How to Measure Volatility In the Markets
In tonight’s update, we’ll show you how to measure volatility across index markets using the Volatility Box.
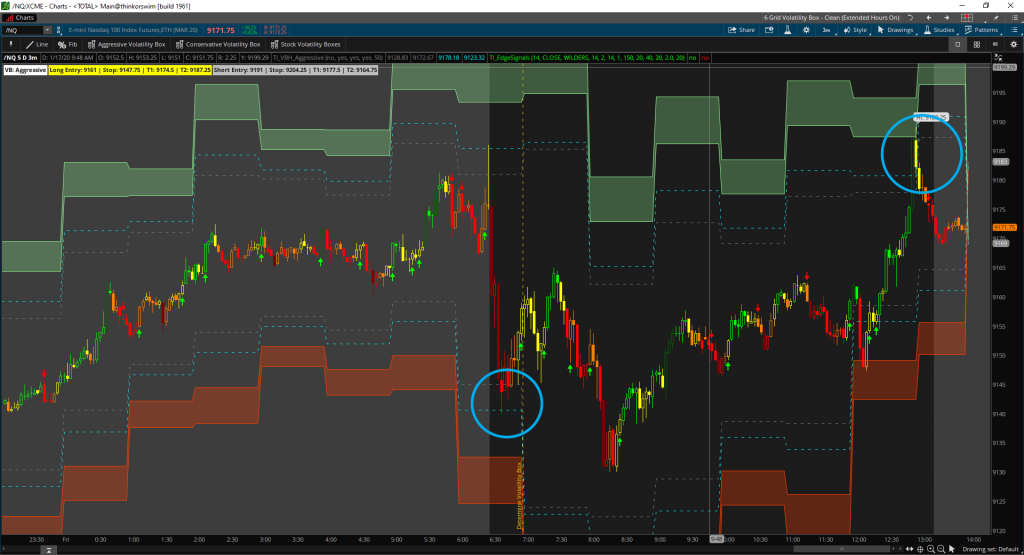
We apply the aggressive Volatility Box to the charts of the S&P, Nasdaq, DOW, and Russell Futures. Within the first 30 minutes of the market open, the Nasdaq index market signaled to us that it was the more volatile one.
While the entries today were not valid, given they came on a Friday afternoon, they did help further build our confidence in our volatility models.
How to Measure Volatility of the Markets Within the First 30 Minutes
With the morning open, we had the S&P, DOW and Russell futures all trading inside of our Aggressive Volatility Box models. However, the Nasdaq was a slightly different story.
When trying to measure volatility across markets, we need to have a tool that puts everything in relative scale. For us, that’s the Volatility Box.
The Nasdaq touching the edge of our Volatility Box entry line, while the rest of the markets did not, is helpful information to narrow our focus.
For stock traders, this may be helpful in determining where your focus is for entries on the day (i.e. Nasdaq top holdings, tech stocks). While our only entry in Nasdaq came towards the end of the day, it was still nice to see the models hold, and the Nasdaq hit its first target.

Likely Trending List – Jan 21, 2020
Using our new Stock Volatility Box Tool, we have a few different symbols that are on our “Trend Trending” list for Tuesday (January 21, 2020). Below is a sample list of just a few of those symbols.
Each of these symbols closed outside of our Volatility Box edge, and we look for them to continue to trending into tomorrow’s session, if they breach our clouds.
- Coty Inc. (COTY)
- Groupon (GRPN)
- Lowes (LOW)
- Qualcomm (QCOM)
- Under Armour (UAA)
- Visa (V)
For all of our Volatility Box members with access to the tool, you can use the list above to create a game plan for tomorrow’s trading.
The key will be to look for price to breach above either the Aggressive or Conservative Volatility Box cloud edge in the first 15 minutes of market open.
Here is a comma-delineated list of the tickers above, that you can input directly into the Stock Volatility Box Tool:
[su_note note_color=”#000″ text_color=”#FFF” radius=”3″ class=””] COTY, GRPN, LOW, QCOM, UAA, V [/su_note]
If we breach above each of those respective levels, then we’ll be looking at those symbols as likely trending candidates for the day.
However, if we do not breach those levels within the first 15 minutes, then we skip the symbol and focus on areas where we have breached.
Conclusion:
XLF earnings holds our attention this week. We look at them not only as trade opportunities using our Smarter Earnings and Stock Volatility Box, but also as a domino falling.
XLU has already rolled over from our last update. A transition in XLF from from acceleration to accumulation would support a pullback in the S&P. This would also help us confirm our put call ratio hypothesis.
Nothing is guaranteed though. Financials could crush earnings, and rip the market higher. This would lead the 10-day put call ratio SMA to remain below our 0.85 threshold for much longer.
Start trading with an edge, at the edge, and sign up for the Volatility Box today
