
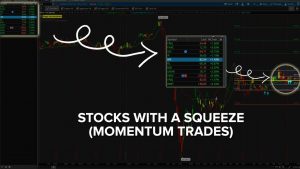
Squeeze Trade Reports
Examples of TTM Squeeze setups, from entry to exit
cATEGORIES
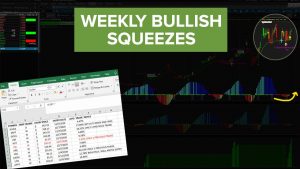
Building a Watchlist of Weekly Time Frame Squeezes
In today’s video, we’ll use the new Slingshot Squeeze scan and backtester to find profitable weekly time squeeze candidates.
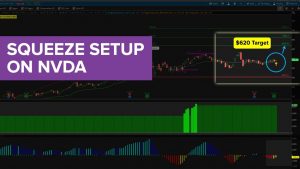
Bullish Daily Squeeze Setting Up on NVDA
In today’s video, we’ll use the new Slingshot Squeeze scan and backtester to
backtest a squeeze in NVDA.
With the backtester, we see that we’ve had 8 bullish squeezes in NVDA, over the past 5 years. With the 8 bullish squeezes, 7 of those have been winners, and 1 was a loser (albeit, a fairly painful loser).
On average, we see that each of the squeeze moves have led to anywhere from a 6-8% move in NVDA from the point of entry. From our current price of $542.33, that takes us to right around
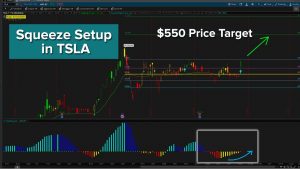
TSLA Broken Wing Butterfly Trade Idea
With the news of Tesla (TSLA) being added to the S&P 500, we have a catalyst to support a bullish trade idea looking for a move to the 1.272% Fibonacci extension.
We have a squeeze that has been gaining momentum, leading to the idea that it will fire long. To play this move in a relatively “expensive” ticker, we’re going to build a broken wing butterfly.
The broken wing butterfly gives us 2 inherent benefits:
1. No upside risk
2. Reduced cost compared to owning the shares outright, or buyi
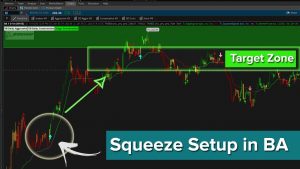
3 Different Trade Setups in Boeing (BA) Stock
We’ll discuss 3 different types of trade setups that occurred today in Boeing (BA), giving you an opportunity to visualize and understand each one.
The 3 trade setups that we’ll discuss are:
1. Bullish Squeeze and Targets
2. Reversal via the Volatility Box
3. Trending Criteria for Tomorrow
In the first setup, we had a bullish Squeeze Signal along with a bullish Market Pulse, suggesting that we expected the stock to continue trending bullishly. Here’s a video detailing that setup in more detail
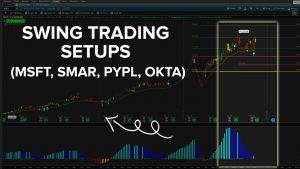
Swing Trading Setups (incl. MSFT, SMAR, PYPL, OKTA)
In today’s video, we’ll use today’s sell off to see where we have longer term, swing trade opportunities setting up.
We’ll use our Squeeze Signals scan (built as part of our Squeeze Course), and take a look at the setups using a weekly time frame chart. For those with access to the course, you can also use the backtester here to see actual P/L results.
With a weekly time frame chart, we have opportunity for better trading entries, and maintaining a longer term perspective. Many of these weekly
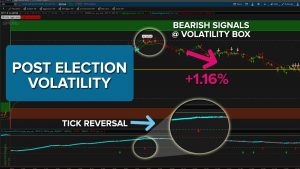
Post-Election Volatility Trading
With the election being a close race, we had a good deal of uncertainty that translated into volatility for our 4 major index markets.
During the after hours activity as the election results were slowly trickling out, we saw the S&P, Nasdaq, DOW and Russell futures all moving wildly (with the NQ up 3.5%+ in after hours). This same volatility continued into the market place today.
As a result of this volatility, we had a variety of different trading opportunities set up, which we’ll discuss in
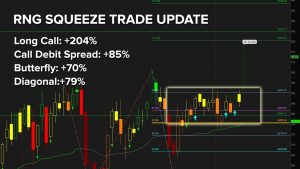
RNG Options Trades Winner Follow Up (Stock Up +9%)
On August 30, 2020, we set up 4 different options trades in Ring Central (RNG), looking for a bullish move to $320.
We were looking at the September series options with 19 DTE, but got the move much sooner in less than 2 days. In today’s video, we’ll do a follow up on picking smart targets, along with an update to the option’s pricing to gauge which strategy was most effective.
The 4 trades that we had set up were:
1 – Long Call ($4.90 now worth $14.90)
2 – Long Call Debit Spread ($3.00 now w
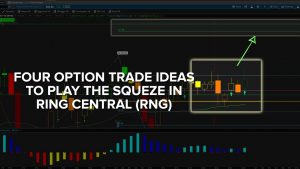
4 Options Trade Ideas in Ring Central (RNG)
In today’s video, I’d like to focus on one stock, which I think has some trade opportunities setting up. We’ll spend some time evaluating the stock chart on a daily time frame, along with its option’s chain.
The stock that we’ll be taking a look at is Ring Central — they started by making the video doorbell, and have expanded their line of offering to a suite of security, and some even non-security applications now.
That’s to say – their product line has been gradually expanding, and I woul
3 Real Estate ETFs Ripe for Momentum Moves
In today’s video, we’ll spend some time going through the Squeeze Signals scan results, to try and find clusters of stocks/ETFs in the same sector.
The Squeeze Signals indicator is an indicator which helps us to combine the power of the Triple Pro Squeeze, along with patterns that usually tend to lead to some nice momentum-burst type movements. We build this indicator as part of the Triple Squeeze Course (free for Volatility Box members): https://www.tosindicators.com/squeeze-course
With toda
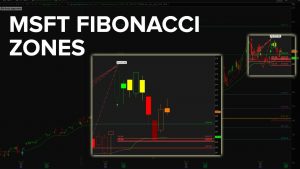
MSFT Fibonacci Levels and Stock Volatility Trades
We’re going to talk about 3 different stock topics in this video:
1 – Microsoft (MSFT) fib zones update, with new levels for entry, along with potential target zones
2 – Bullish short squeeze trade opportunity in PAGS
3 – Review of 3 Stock Volatility Box trades in ADSK, DDOG and GMAB
With MSFT, we’ve seen a pullback into the Fibonacci levels on this entire recovery move up, and we’re looking for a similar continuation of trend to the 1.618% extension.
In PAGS, we have a squeeze that looks l
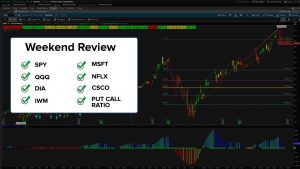
Fibonacci Levels – SPY, QQQ, IWM, DIA, MSFT, NFLX and CSCO
Once again, we have a nice pullback setting up in the markets, giving us some new opportunities to enter on a trend pullback.
In this video, we’re going to start by reviewing what the SPY, QQQ, DIA AND IWM are telling us, by using price action, volume and Fibs. While QQQ currently offers us the most Fibonacci-support, it’s also the most extended (duh), having reached its 1.272% extension of the Feb-March swing high to low.
We’re going to use that to dive deeper into some stocks in the Nasdaq,

High Short Interest and Bullish Squeeze in Lumentum (LITE)
In less than 5 minutes, we’re going to scan through 60 stocks to find high short interest trade opportunities (using the weekly time frame).
The scan that we use in today’s video is our Edge Signals scan, looking to find places where we had the signal print bullish with last week’s close. We also overlaid a squeeze condition on top, looking for a squeeze likely to fire long.
Using that list, we have these 4 stocks, that looked interesting and had relatively high short interest:
IFF,
VCTY,
T
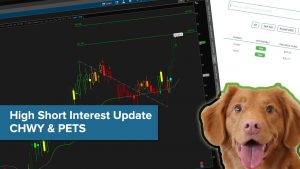
High Short Interest Update in CHWY and PETS
Over the weekend, we set up trades in CHWY and PETS, with the help of our new short interest scanner.
Both CHWY and PETS had high short interest, but we also had some key executives selling their shares. This gave us a reason to be cautious, and set up more of a hedge-type trade, as opposed to an outright directional play.
Our final trade was looking for a bullish move in CHWY, with a bearish hedge in PETS, which was the weaker of the two charts.
Since making the video, CHWY has increased +1
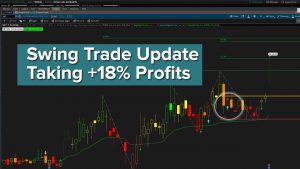
Update to Swing Trade in CloudFlare (Taking +18% Profits)
Start trading with an edge, at the edge, and sign up for the Volatility Box today
Bullish and Bearish Swing Trade Setups (April 2020)
An overview of bullish and bearish TTM Squeeze setups with high probabilities.
- « Previous
- 1
- 2
- 3
- 4