
Stock Trade Reports
Stock and options trade ideas, recaps, and insights
cATEGORIES
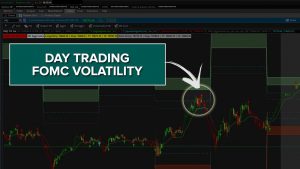
Trading FOMC Volatility – Futures & Stock Setups
With the FOMC event today, we saw a burst of volatility in our futures markets leading to a series of breaches in /ES, /NQ, /GC and /HG.
The S&P 500, Nasdaq and Copper futures trades were all winners, while the Gold trade was a loser. In today’s video, we’ll do a recap of all 5 of the trade setups that we had today, for a net P/L of +$805.
Outside of that, we’ll also talk about some swing trade setups that are still active and valid. With Powell’s remarks, we can look to take advantage of ar

Day Trading Silver Futures (/SI) and AMD
In today’s video, we’ll break down day trades in the Silver Futures market (/SI), along with AMD.
Both Silver and AMD have been on the radars of a lot of traders, especially with their recent volatility. We’ve seen momentum kick into full gear in Silver, while related markets like Gold make all time high’s.
This increased volatility is opportunity for us, as volatility traders. In Silver, we had a total of 4 trades, 3 of which were winners for a net P/L of +$3,680.l We also had 1 trade in Natu
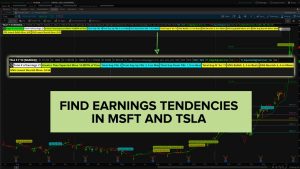
Preparing for MSFT and TSLA Post-Earnings Moves
With earnings season started, we’re going to use the free Smarter Earnings indicator to show you how you can plan and prepare for likely post-earnings moves.
Download Smarter Earnings indicator (free): https://www.tosindicators.com/indicators/smarter-earnings
Starting with the Futures Volatility Box, we had two trade setups today in Gold. The first setup was a stop-out, which cost us 4.5 points per contract, and had us switch from our Aggressive Volatility Box models to our Doomsday Aggres

Post-Earnings Volatility Box Setup
With earnings activity starting to pick back up, we’ll talk about a fairly simple, yet effective setup to play post-earnings moves in your favorite stocks.
For today’s example, we’re going to use IBM, which reported before the market open (and had an earnings beat). On the beat, IBM gapped up higher, but then continued to fill its gap and trend lower for the rest of the day.
The setup comes in looking to “buy the dip” or “fade the rip” and using earnings as a catalyst for a high volatility ev
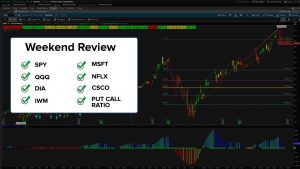
Fibonacci Levels – SPY, QQQ, IWM, DIA, MSFT, NFLX and CSCO
Once again, we have a nice pullback setting up in the markets, giving us some new opportunities to enter on a trend pullback.
In this video, we’re going to start by reviewing what the SPY, QQQ, DIA AND IWM are telling us, by using price action, volume and Fibs. While QQQ currently offers us the most Fibonacci-support, it’s also the most extended (duh), having reached its 1.272% extension of the Feb-March swing high to low.
We’re going to use that to dive deeper into some stocks in the Nasdaq,
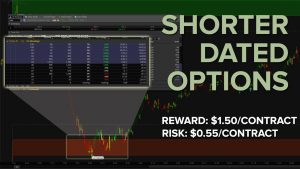
How to Use Shorter Dated Options to Skew R/R in Your Favor
We’re going to compare 1 vs. 8 days to expiration (DTE) options, to see what the delta looks like, in terms of the returns of each strategy.
We had over 90 setups that hit our Live Scanner today, with a focus on “Buying the Dip” — this means Aggressive VB Long and Conservative VB Long setups.
Of those 90, we’re going to focus on 6 in particular that met the following conditions:
1. Hit the Volatility Box edge
2. Got an Edge Signal
3. Opportunity to enter at the VB clouds or better, before

High Short Interest and Bullish Squeeze in Lumentum (LITE)
In less than 5 minutes, we’re going to scan through 60 stocks to find high short interest trade opportunities (using the weekly time frame).
The scan that we use in today’s video is our Edge Signals scan, looking to find places where we had the signal print bullish with last week’s close. We also overlaid a squeeze condition on top, looking for a squeeze likely to fire long.
Using that list, we have these 4 stocks, that looked interesting and had relatively high short interest:
IFF,
VCTY,
T
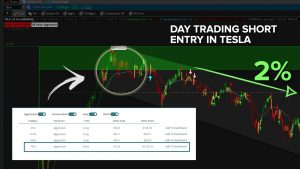
Day Trading TSLA, NFLX and 8 Other Stocks
We’re going to talk about 10 day trading setups that we had today via the Stock Volatility Box platform (including TSLA and NFLX).
Imagine outsourcing all of the work of finding trades to a machine, and then getting to pick and choose your favorite symbols? Well, with the Stock Volatility Box platform, we’ve built a powerful Live Scanner, which is constantly scanning the market every 15 to 20 seconds, to look for Volatility Box edge entries.
Using the Live Scanner, we had 117 total trades th
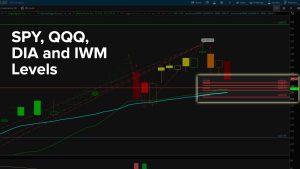
SPY, QQQ, DIA and IWM Buy Zones and Triggers
We saw a broader sell off in the indices with Friday’s trading, leading many top weighted holdings to start to pull back to entry zones.
In this video, we’re going to use a few different perspectives (and indicators) to create a game plan, with specific levels that I’m interested in buying as support on the SPY, QQQ, DIA, and IWM.
We’re going to use the following tools for the analysis:
1. Put Call Ratio in the Utility Labels
2. Market Pulse Line
3. Fibonacci Retracements and Extensions
4.
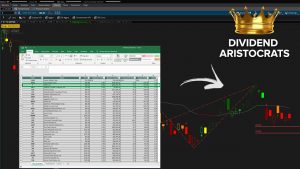
Finding Trade Opportunities in the Dividend Aristocrats
The Dividend Aristocrats is a list of S&P 500 stocks, that have been increasing their dividends for 25+ consecutive years.
The full list is available for free download: https://www.suredividend.com/dividend-aristocrats-list/
This gives us an instant list of high quality stocks, where we can start to look, to find opportunity when most everything else in the marketplace feels extended. There are currently 66 stocks on the Dividend Aristocrats list (June 2020), and we’ll be focusing on one in p
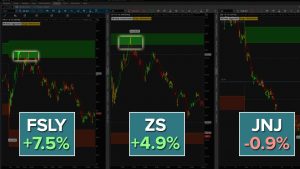
Trading FSLY, ZS and JNJ On a Down Day
On a day in which the S&P was down 5.43%, we still found a way to be profitable with both long AND short setups using the Volatility Box.
In today’s video, we’re going to revisit the 6 takeaways that we had discovered in the “Analyzing Friday’s Stock Market Flow” video (linked below):
https://www.youtube.com/watch?v=hhzAhWK8zKs
We’ll go through a handful of trades using the takeaways and observations that we’ve been discussing in these Trade Report videos. For example, we discovered that 6:3
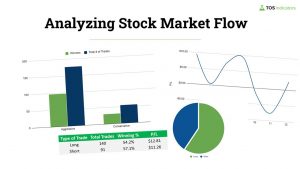
Analyzing Friday’s Stock Market Flow
We’re going to use all 231 Volatility Box trade setups to chart out Friday’s stock market flow, to see if there are any interesting patterns that stand out.
We’ll compare things like the Aggressive vs. Conservative Volatility Box models, along with answering some common questions, such as “Is there a specific time of day that’s better for trading stocks than others?”
There are 6 different dimensions that we’ll use for this analysis:
1. Aggressive vs. Conservative
2. Long vs. Short
3. Combine
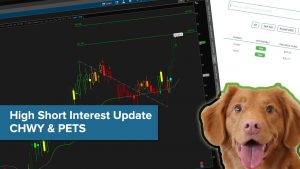
High Short Interest Update in CHWY and PETS
Over the weekend, we set up trades in CHWY and PETS, with the help of our new short interest scanner.
Both CHWY and PETS had high short interest, but we also had some key executives selling their shares. This gave us a reason to be cautious, and set up more of a hedge-type trade, as opposed to an outright directional play.
Our final trade was looking for a bullish move in CHWY, with a bearish hedge in PETS, which was the weaker of the two charts.
Since making the video, CHWY has increased +1
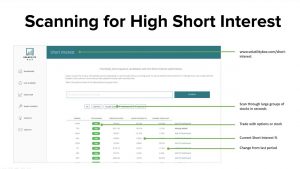
Scanning for High Short Interest Trade Opportunities
A step-by-step guide on how to scan for high short interest in 13,000+ stocks and ETFs.
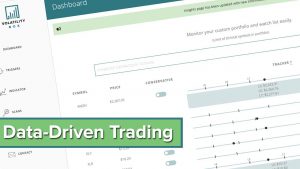
Trading Fridays’ with the Stock Volatility Box (29 Total Setups)
A data-driven approach to trading Friday expirations with the Stock Volatility Box platform.