
Stock Trade Reports
Stock and options trade ideas, recaps, and insights
cATEGORIES
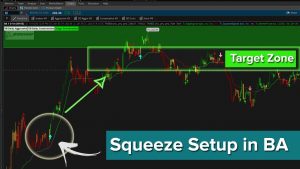
3 Different Trade Setups in Boeing (BA) Stock
We’ll discuss 3 different types of trade setups that occurred today in Boeing (BA), giving you an opportunity to visualize and understand each one.
The 3 trade setups that we’ll discuss are:
1. Bullish Squeeze and Targets
2. Reversal via the Volatility Box
3. Trending Criteria for Tomorrow
In the first setup, we had a bullish Squeeze Signal along with a bullish Market Pulse, suggesting that we expected the stock to continue trending bullishly. Here’s a video detailing that setup in more detail
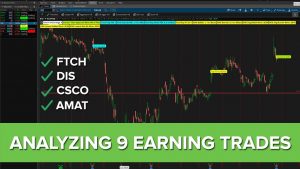
FTCH, DIS, AMAT and CSCO Earnings Plays
In today’s video, we’ll cycle through 9 different companies reporting earnings today after the close, to try and find trade ideas. For this exercise, we’ll use our Smarter Earnings indicator, which is available for free here: https://www.tosindicators.com/indicators/smarter-earnings
From the 9 trades, here are our final results:
FTCH – Looking for a bullish gap n go, avg bullish move is $1.69, lowest move is $0.24
DIS – Looking for a bullish gap n go, avg bullish move $3.48, lowest move is $0
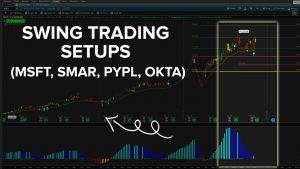
Swing Trading Setups (incl. MSFT, SMAR, PYPL, OKTA)
In today’s video, we’ll use today’s sell off to see where we have longer term, swing trade opportunities setting up.
We’ll use our Squeeze Signals scan (built as part of our Squeeze Course), and take a look at the setups using a weekly time frame chart. For those with access to the course, you can also use the backtester here to see actual P/L results.
With a weekly time frame chart, we have opportunity for better trading entries, and maintaining a longer term perspective. Many of these weekly
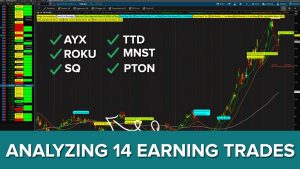
14 Earning Trade Ideas (incl. AYX, TTD, ROKU, SQ)
In today’s video, we’ll cycle through 14 different earnings charts to try and find trade ideas. For this exercise, we’ll use our Smarter Earnings indicator, which is available for free here: https://www.tosindicators.com/indicators/smarter-earnings
From the 14 trades, here are our final results:
AYX- looking for a gap down, and a fill of that gap off of a beat
MNST – looking for a potential gap n go, avg move $2.33, lowest is $1.21
ROKU – looking for a bullish move — either gap fill or gap n
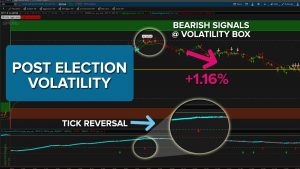
Post-Election Volatility Trading
With the election being a close race, we had a good deal of uncertainty that translated into volatility for our 4 major index markets.
During the after hours activity as the election results were slowly trickling out, we saw the S&P, Nasdaq, DOW and Russell futures all moving wildly (with the NQ up 3.5%+ in after hours). This same volatility continued into the market place today.
As a result of this volatility, we had a variety of different trading opportunities set up, which we’ll discuss in
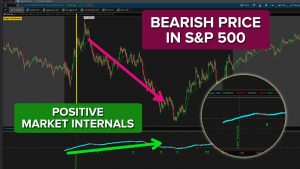
Pre-Election Volatility in the S&P 500
With the election tomorrow night, we’re starting to see some of the “funkiness” that we would expect from pre-election night volatility in the S&P 500.
Specifically today, we had the market internals suggest to us to expect more buying pressure as the day progressed. We also saw a steady rise in the Cumulative TICK indicator, suggesting more buying than selling pressure.
However, when you contrast that with what price action actually did, we’ll see a much different story. Instead of price go
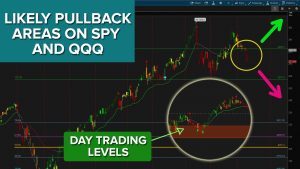
Pullback Levels on S&P and Nasdaq
With today’s selling pressure, supported by high volume, we’ll take a look at potential pullback zones in the S&P 500 (SPY) and Nasdaq (QQQ).
Using Fibonacci, we see in the Nasdaq that we’ve hit the 1.618 extension, and are now pulling back. With the S&P, we have open gaps below us, which look like they are likely to be filled.
In case you’re interested, you can also replicate the same process that we use in tonight’s video on the DOW and Russell as well, for pullback zones.
After discuss

Hourly and Daily Volatility Levels – SPY, QQQ, DIA, IWM
As volatility traders, the 2020 election has led to an increase in not only volatility, but also trade opportunities in many of the major markets.
In today’s video, we’ll contrast our Hourly Volatility Box levels with the Daily Volatility Box levels in the 4 major indices. We’ll take a look at ES vs. SPY, NQ vs. QQQ, DIA vs. YM, and IWM vs. RTY.
We’ll also highlight the “Likely Trending Down” heads up that we received with the Cumulative TICK Pro indicator, and how to trade using market inte
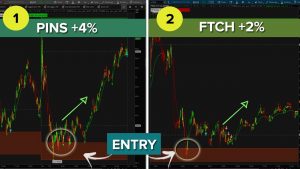
Stimulus Volatility – Futures and Stock Trades
We had stimulus volatility act as a catalyst, leading to some nice trade setups in both futures and stocks.
In today’s video, we’ll cover trades in the 4 major index market futures, along with some stock setups in Pinterest (PINS), FarFetch (FTCH), Baidu (BIDU) and DOW Inc. (DOW).
The first half of the video will focus on the indices trades, where similar to this week, we had 3 winners and 1 loser. We had some nice gains in the /ES, /YM and /RTY futures, while the /NQ was a loser.
With sto
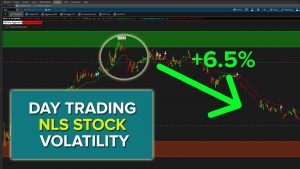
Day Trading NLS Stock Volatility (and 5 Other Stocks)
We had NLS stock hit our Volatility Box Live Scanner today, which gave us a beautiful opportunity to trade the volatility and catch the reversal move in NLS. This same setup existed for 5 other stocks as well, which we’ll discuss in today’s video.
The Live Scanner is a machine that we’ve built, which constantly keeps giving you trade ideas as they set up. The scanner usually refreshes every 15 or so seconds with any new trades that are setting up.
For today’s performance recap, there are two
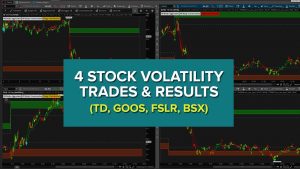
4 Stock Volatility Trades and Results (TD, GOOS, FSLR, BSX)
In this video, we’ll review the Stock Volatility Box’s performance for today, diving deeper into 4 specific trade setups.
Today, we had 23 trades that hit our Live Scanner in the first four hours (from 6-10am PT). The Live Scanner is a machine that we’ve built, which plots stock entries as they setup, with specific entry, target and stop prices.
Specifically, we’ll dive deeper into the charts of TD, GOOS, FSLR and BSX.
1. TD – Aggressive Long Trade Entry (Winner)
2. GOOS – Aggressive Long Tr
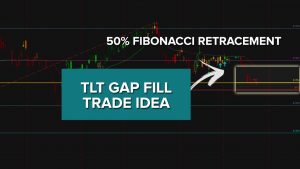
TLT Fibonacci Trade Idea (50% Retracement Pullback)
With a rather peculiar year, we’ve seen markets like TLT have a greater than average percentage gain, so far into 2020.
In today’s video, we’ll discuss a trade idea setting up in TLT, as a result of the recent gap lower. Price action is currently hovering around the 50% retracement mark, using the swing high to swing low in TLT.
Additionally, if we use a previous swing high to swing low Fibonacci retracement, we’re able to create a cluster zone. So far, price action has respected this zone,
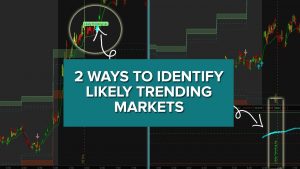
2 Ways to Identify Trending Markets
We have two easy ways to discover likely trending markets, using data-driven tools that we’ve created. In today’s video, we’ll discuss both of those methods and break them down with some examples.
Our first method of identify trending markets is built inside of the Volatility Box. We’ve used data here to identify specific price action clues in the first few hours of the market being open, to determine whether the market is likely to trend.
Today, we had Copper give us the indication that we sh
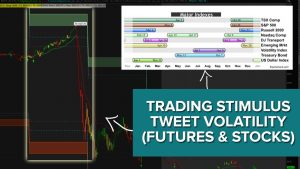
Stimulus Update Volatility – Futures & Stock Trade Setups
In today’s video we’re going to talk about the volatility we saw in the markets, as a result of Trump’s tweets, stating that stimulus negotiations were going to be pushed till post-election.
This was something the market did not expect, and we saw that reflected in the price action. Across the board, the S&P 500, Nasdaq, DOW, Russell, 30-YR Bond, Energies, you name it — almost all major markets saw a volatile reaction to this news.
This ended up becoming our catalyst for both futures and stoc
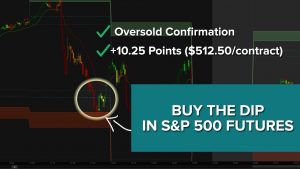
S&P 500 (/ES) – Buy the Dip Futures Setup
We had several “Buy the Dip” setup opportunities in our futures markets, towards the final few hours of the close.
Our first setup which we’ll discuss in today’s video was in the /ES (S&P 500) futures. We had an opportunity to buy the dip, and go long the /ES futures markets. This trade was good for 10.25 points in the /ES futures, which resulted in a gain of $512.50/contract.
Our second setup was in the RTY futures (Russell 2K), which was similar, but fell short of our target by 0.4 ticks. Ul