
Stock Trade Reports
Stock and options trade ideas, recaps, and insights
cATEGORIES
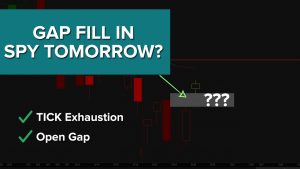
SPY Gap Fill With Cumulative TICK Data (OTM Put Debit Spread)
Similar to last week, we’re going to continue using the Cumulative TICKs to find clues around what to expect in the S&P 500 for tomorrow.
With the close today, we had our Cumulative TICK Pro indicator suggesting that we had a likely bullish trend exhaustion. Typically, this is met with a reversal the next day. We had something similar set up last Thursday, with a bearish trend exhaustion signal, and saw a nice rally to close on Friday.
We’ll use this data and observation to build a trade in S
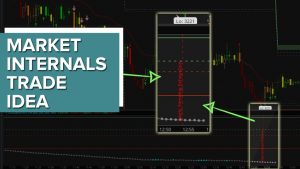
Bullish Reversal Trade Idea in SPY – Market Internals Data
The Cumulative TICK Pro signaled to us to expect a likely bearish trend exhaustion with today’s activity. We’ll use this information to create a game plan for tomorrow’s trading.
Specifically, I’m looking for the bearish trend that we had into the final hours of the market to halt, and reverse into tomorrow. Below, you’ll find a brief game plan that is expanded upon more in tonight’s video.
➡️ WHAT WE’RE EXPECTING:
A bullish reversal, after a morning decline. The Cumulative TICKs suggested t
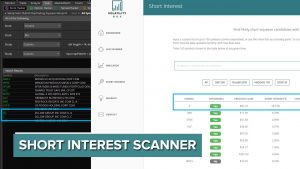
Short Interest Squeeze in Zillow (Z)
In today’s video, we’ll walk through the fairly simple process of finding high short interest squeeze opportunities.
We start by first using our Bullish Squeeze Signal scan. The Squeeze Signal is an indicator that we’ve built as part of the Squeeze Course, which helps us find stocks likely to have a momentum move higher.
Next, we’ll copy all of those stocks directly from ThinkOrSwim, and paste them into an Excel sheet. We use this formula to then comma separate the list:
= A1&”,”
After applyi
Stock Volatility Trades in NVTA, SPY and QQQ
In this video, we’ll review the Stock Volatility Box’s performance for today, as well as dive deeper into the charts of NVTA, SPY and QQQ to look at 3 specific setups.
With the recent burst of volatility, we’ve seen more stocks hit our Live Scanner compared to usual. The Live Scanner is a “machine” that we’ve built, whose job is to update every 15 seconds with new trades that breach our Volatility Box edges.
Today, we had more than 229 trades that hit our Live Scanner over the course of the

Trading Daily and Hourly Volatility Levels on Indices
After 3 days of breaking outside of our most conservative models, we saw price action start to stabilize just a bit.
In today’s video, we’ll layer on both our hourly and daily volatility ranges to look and trade the indices. We sent out the daily volatility ranges, part of the Stock Volatility Box platform, to all of our Futures VB members as well, which ended up triggering for some nice trades across the board.
Via our Futures VB levels, we had a total of 7 trades, with a net P/L of +$1,410,
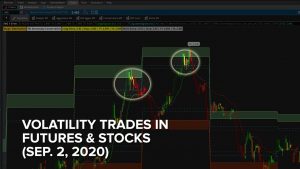
Volatility Trades in Tech Stocks and Futures (Sept. 2, 2020)
We had the Nasdaq futures break outside of our Doomsday Conservative (our most conservative) volatility models within the first 30 minute after market open. With that same downfall, we had a group of tech stocks all hit our Stock Volatility Box Live Scanner, giving us plenty of opportunities to look for fade trade setups.
In today’s video, we’ll discuss both stock and futures trades, along with ways to overlap the Stock and Futures Volatility Boxes to work in congruence. With Nasdaq breaking ou
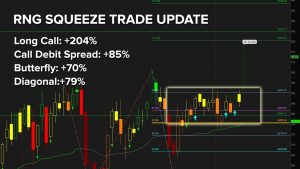
RNG Options Trades Winner Follow Up (Stock Up +9%)
On August 30, 2020, we set up 4 different options trades in Ring Central (RNG), looking for a bullish move to $320.
We were looking at the September series options with 19 DTE, but got the move much sooner in less than 2 days. In today’s video, we’ll do a follow up on picking smart targets, along with an update to the option’s pricing to gauge which strategy was most effective.
The 4 trades that we had set up were:
1 – Long Call ($4.90 now worth $14.90)
2 – Long Call Debit Spread ($3.00 now w
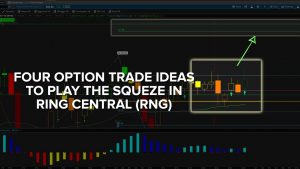
4 Options Trade Ideas in Ring Central (RNG)
In today’s video, I’d like to focus on one stock, which I think has some trade opportunities setting up. We’ll spend some time evaluating the stock chart on a daily time frame, along with its option’s chain.
The stock that we’ll be taking a look at is Ring Central — they started by making the video doorbell, and have expanded their line of offering to a suite of security, and some even non-security applications now.
That’s to say – their product line has been gradually expanding, and I woul
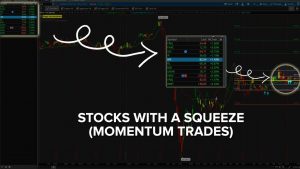
3 Real Estate ETFs Ripe for Momentum Moves
In today’s video, we’ll spend some time going through the Squeeze Signals scan results, to try and find clusters of stocks/ETFs in the same sector.
The Squeeze Signals indicator is an indicator which helps us to combine the power of the Triple Pro Squeeze, along with patterns that usually tend to lead to some nice momentum-burst type movements. We build this indicator as part of the Triple Squeeze Course (free for Volatility Box members): https://www.tosindicators.com/squeeze-course
With toda

High Short Interest Near 52 Week Highs (thinkScript)
Build a simple scan in which to find stocks that are near their 52 week highs, that ALSO have high short interest.
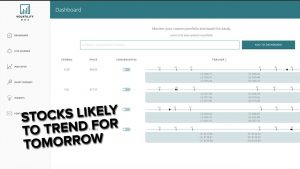
Stocks Likely to Trend Tomorrow
In today’s video, we’ll walk you through the Nightly Trending List, which contains stocks we think are likely to trend for tomorrow.
This list contains a group of stocks, usually 3-6, that our models suggest are likely to trend for the next day. These are stocks that have closed within our Volatility Box zones, and we expect either the buying or selling pressure to continue the next day.
Tonight, we’ll also layer on a high-level option’s chain analysis, using Open Interest and Probability of
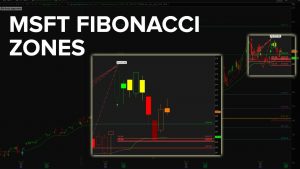
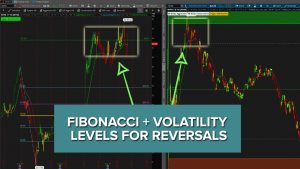
MSFT Fibonacci Levels and Stock Volatility Trades
We’re going to talk about 3 different stock topics in this video:
1 – Microsoft (MSFT) fib zones update, with new levels for entry, along with potential target zones
2 – Bullish short squeeze trade opportunity in PAGS
3 – Review of 3 Stock Volatility Box trades in ADSK, DDOG and GMAB
With MSFT, we’ve seen a pullback into the Fibonacci levels on this entire recovery move up, and we’re looking for a similar continuation of trend to the 1.618% extension.
In PAGS, we have a squeeze that looks l
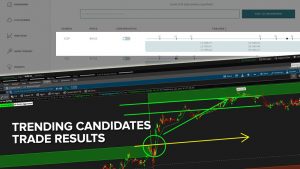
Follow-Up: Nightly Trending List Trade Results
In today’s video, we’re going to review the stocks that we had in our Nightly Trending List, to see what actually happened.
Yesterday, we had 4 stocks that we thought were likely to trend for today:
CCEP, CGC, HFC, and MSI
Out of those 4 stocks, we had 3 that met our rules and triggered trade entries. These are stocks that breached the outside of the previous day’s Volatility Box clouds, and we expected either buyers or sellers to resume control.
CCEP – Triggered and was a picture perfect t
Walking Through the Nightly Trending List
In today’s video, we’ll do a walk through of our Nightly Trending List, which we send to all of our Stock Volatility Box members every night.
This list contains a group of stocks, usually 3-6, that our models suggest are likely to trend for the next day. These are stocks that have closed within our Volatility Box zones, and we expect either the buying or selling pressure to continue the next day.
Today’s List: CCEP, CGC, HFC, MIS
We’ll also layer on the Smarter Earnings Tool to use some Gap N
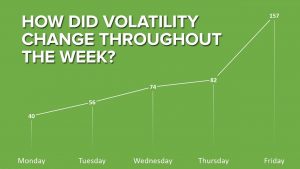
Measuring Volatility Across the Week (Using Stocks)
Let’s take a look at the volatility over the span of an entire week (7/27 – 7/31), to see how volatility changes.
Using Stock VB breaches as our measure of volatility, we saw that volatility increased substantially, from Monday all the way through Friday. For example, on Monday, we saw that we had a total of 40 volatility box breach setups. On Friday, that number had increased to 157 (wow!).
In this video, we’ll dive deeper into all 4 models, along with their winning % rate, and average P/L