
Volatility Box Trade Examples
Volatility models to help you trade stocks and futures like a seasoned professional
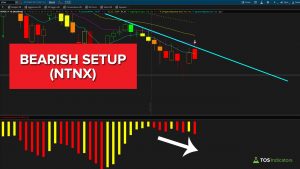
Bearish Trade Setup – NTNX
I’ll walk through a bearish setup in NTNX, that stems from an overall bearish trend line, bearish stacked moving averages and a bearish squeeze that is forming.
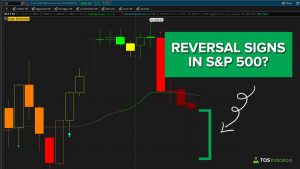
S&P 500 – Tug of War Between Buyers vs. Sellers
In today’s video, I’ll share the criteria that I’m looking for to signal a potential bounce in the S&P 500, DOW, Nasdaq and Russell.
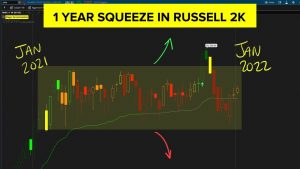
Russell 2000 – Finally Breaking Out of a 1 Year Squeeze?
The Russell 2000 has been in a 1-year consolidation pattern, starting in January 2021. In this video, let’s take a look at break out signs.
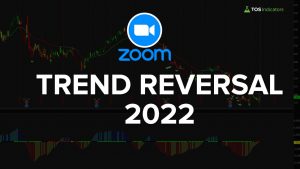
A Trend Reversal Setup for 2022 in Zoom (ZM)
After an incredible run in 2020, Zoom saw a correction for much of 2021. In today’s video, I’ll share the signs I’m monitoring for yet another trend switch in Zoom.
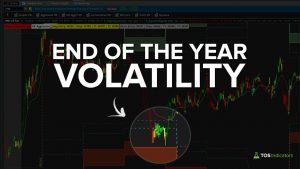
S&P, DOW and Nasdaq Volatility – End of the Year (2021)
In today’s video, we’ll break down the 3 different markets, and trades we had in each. YM was the most profitable market today, but also the most volatile, requiring us to be on the Aggressive Volatility Box models.
Follow-Up: NASDAQ Fibonacci Zones (Dec. 2021)
In today’s video, I’ll review the two bounces inside of the Nasdaq, from our Fibonacci zones, and the trade results in each of those bounces.
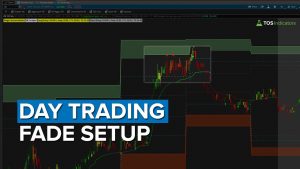
Day Trading Fade Setup – Nasdaq and Russell Trades Walkthrough
In today’s video, I’ll share another step-by-step breakdown of our day trading fade setup, this time inside of the Nasdaq and Russell index markets.
Day Trading Fade Setup – Silver Trade Walkthrough
In today’s video, I’ll share a step-by-step breakdown of a day trading fade setup, using the Futures Volatility Box.
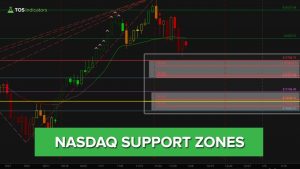
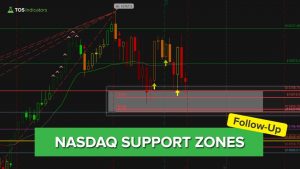
NASDAQ Fibonacci Support Zones
In today’s video, I’ll share the exact zones I’m monitoring inside of the Nasdaq, for the selling to stop, and price action to reverse.
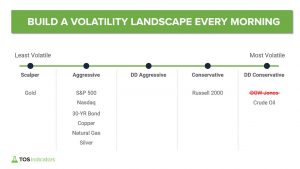
Volatility Landscape – Filter Markets to Focus on Trading
In today’s video, I’ll show you how you can build your own volatility landscape assessment every morning, to pick and choose the markets you’d like to trade.
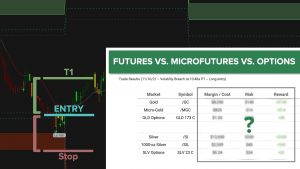
Futures vs. Microfutures vs. ETF Options – Gold/Silver Trade Comparison
A side-by-side comparison between futures, microfutures, and ETFs for two key metals (Gold and Silver).
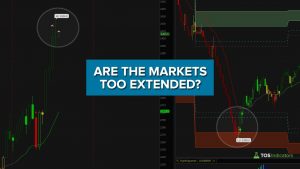
Are the Markets Too Extended?
A step-by-step guide on how to determine if a market is extended, and likely to revert back to its mean.
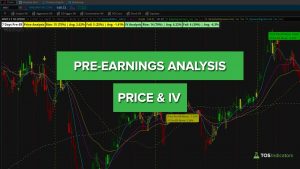
Pre-Earnings Patterns in WMT and HD
In today’s video, we’ll find pre-earnings patterns and tendencies inside of two particular stocks – Walmart (WMT) and Home Depot (HD).
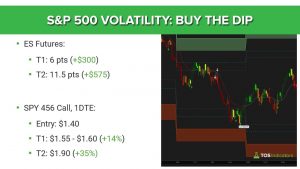
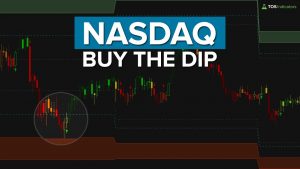
S&P 500 Volatility – ES Futures vs. SPY Call Options
In today’s video, we’ll break down the S&P 500 in particular, focusing in on the “Buy the Dip” setup that triggered in between the 9-10am PT hour.
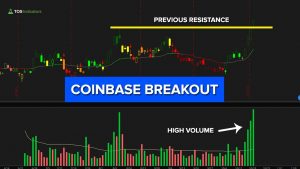
Coinbase (COIN) Breakout Above Previous Resistance with High Volume
In today’s video, I’ll walk through a breakout that has triggered inside of Coinbase stock (COIN), along with break down a futures reversal trade setup inside of Gold futures (/GC).
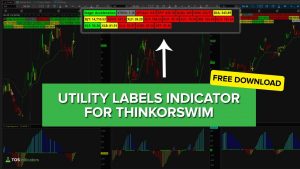
Utility Labels Indicator for ThinkOrSwim – Quick Sector Overview
Let’s walk through an example of how to use our free Utility Labels indicator, available for ThinkOrSwim.
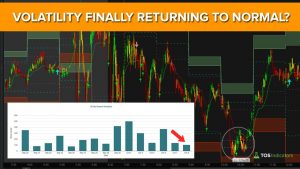
Is Volatility Finally Returning Back to Normal?
We’re starting to see 3 very clear signs that volatility may be starting to slowly decrease, after the September 2021 sell-off.
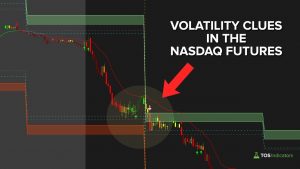
Why the Nasdaq was a Leading Volatility Indicator This Morning
I’ll walk through our 10-minute process that you can follow every morning, to find volatility clues and leading markets.
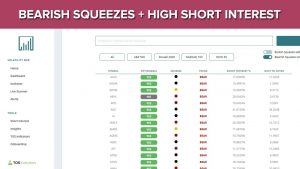
3 Stocks with Bearish Squeezes and High Short Interest
With the market continuing its plummet downwards, we will find opportunities inside of the S&P 500 that have bearish stacked moving averages, with a squeeze forming, and greater than 10% short interest.
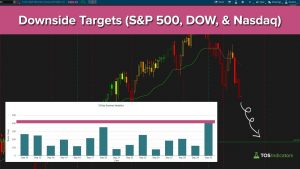
Downside Targets for S&P 500, DOW, and Nasdaq (Sep. 2021)
The major indices have all turned bearish, and in today’s video we’ll take a look at downside targets using Fibonacci.
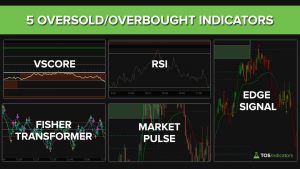
5 Oversold Indicators for ThinkOrSwim
In this video, we will compare and measure 5 different overbought/oversold confirmation signals against each other, to find which is the most effective indicator.