Bear Market Relief Rally – A Deep Dive in SPY, QQQ, DIA, and IWM
The stock market is a roller coaster, and we all know that there are going to be highs and lows. When the market dips into a bear market, it can be tough for investors.
However, a relief rally can provide an opportunity for savvy investors to make some good profits.

In this short tutorial, we will discuss what relief rallies are, why they are important, and how you can find them in ThinkOrSwim using some simple thinkScript code.
What is a Bear Market Relief Rally?
A bear market relief rally is a short-term increase (or rally) in stock prices that occurs during a prolonged period of decline (aka bear market).
They are often caused by investors who believe that the worst of the decline is over and start buying stocks again, leading to a temporary increase in prices.
However, it is important to note that relief rallies can also occur during periods of market uncertainty and can be quickly followed by another decline.
How To Profit From a Relief Rally?
The best way to take advantage of relief rallies is to be patient and wait for the market to show some signs of stabilization.
Once the market starts to show some positive momentum, you can start looking for stocks that have good fundamentals and are trading at attractive prices.
Here are some ideas:
- Large caps trading near historically low P/E ratios, with technical setups
- Beaten up growth stocks with squeeze setups, using tight stops (and/or options for defined risk)
- Oversold value stocks that have been in a long-term uptrend
- Dividend stocks with solid fundamentals and yield support
You can use technical analysis to find these stocks, or you can even screen for them using fundamental criteria.
The key with relief rallies is to have a plan for your trade, and trade that plan.
Being disciplined with stops, entries, and targets is all the more important, when trying to profit from relief rallies, in an overall down trend.
How To Find Previous Relief Rallies in ThinkOrSwim
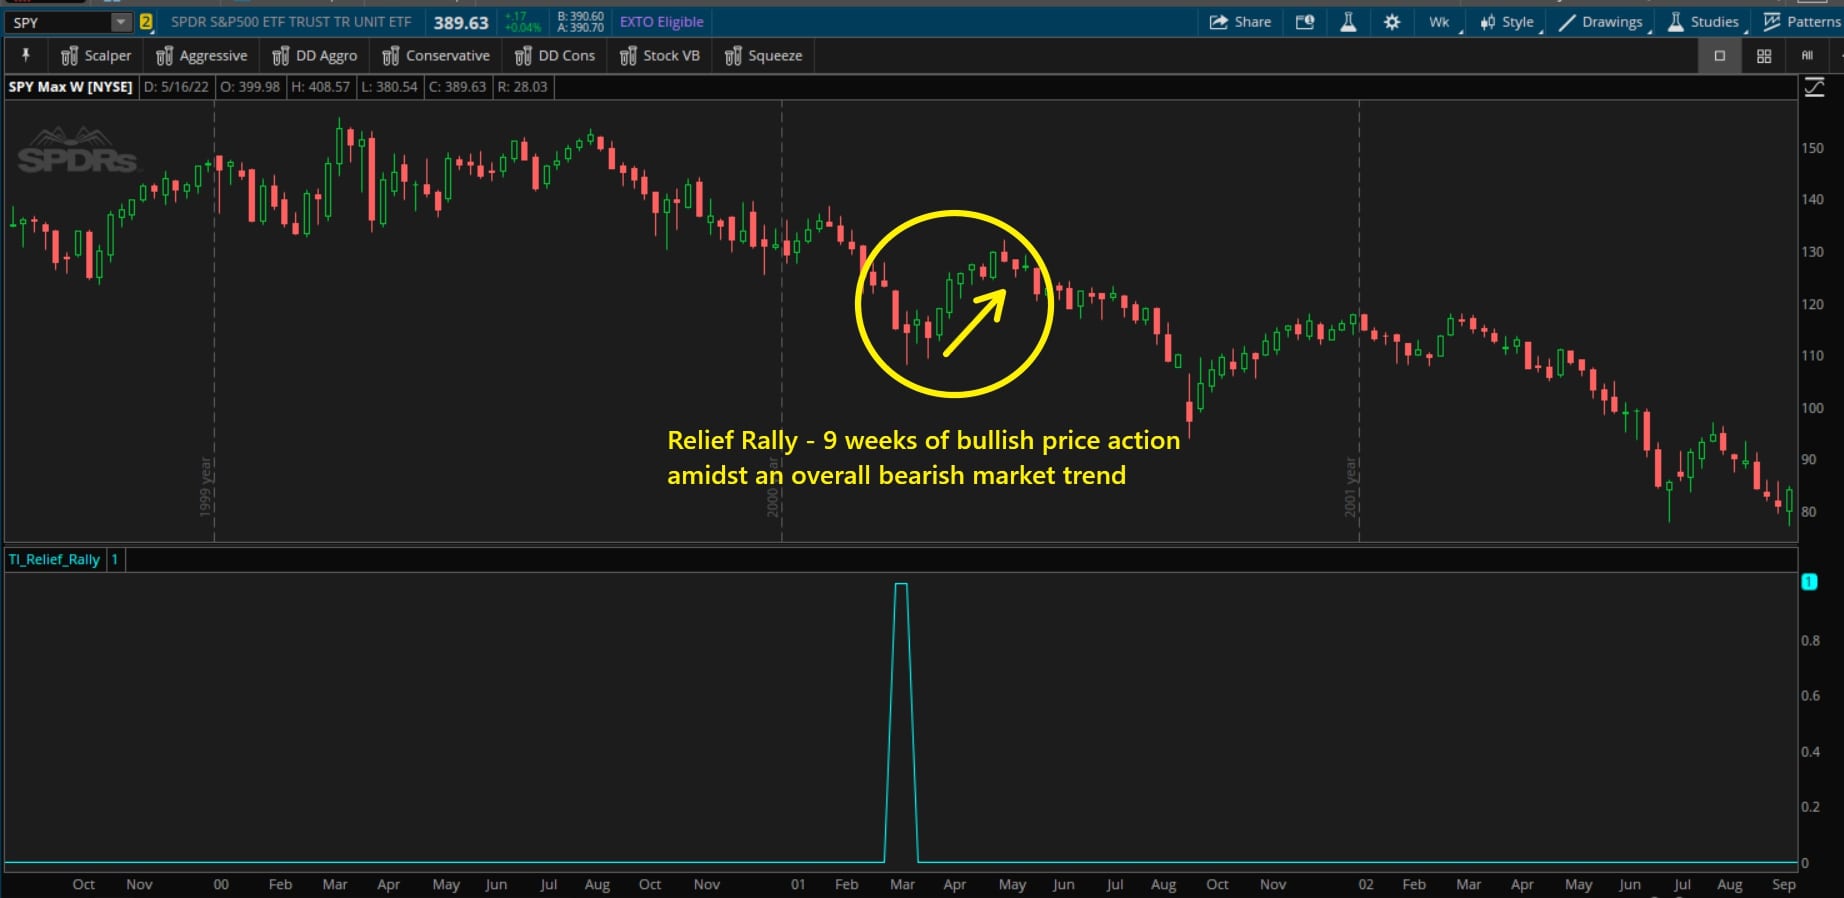
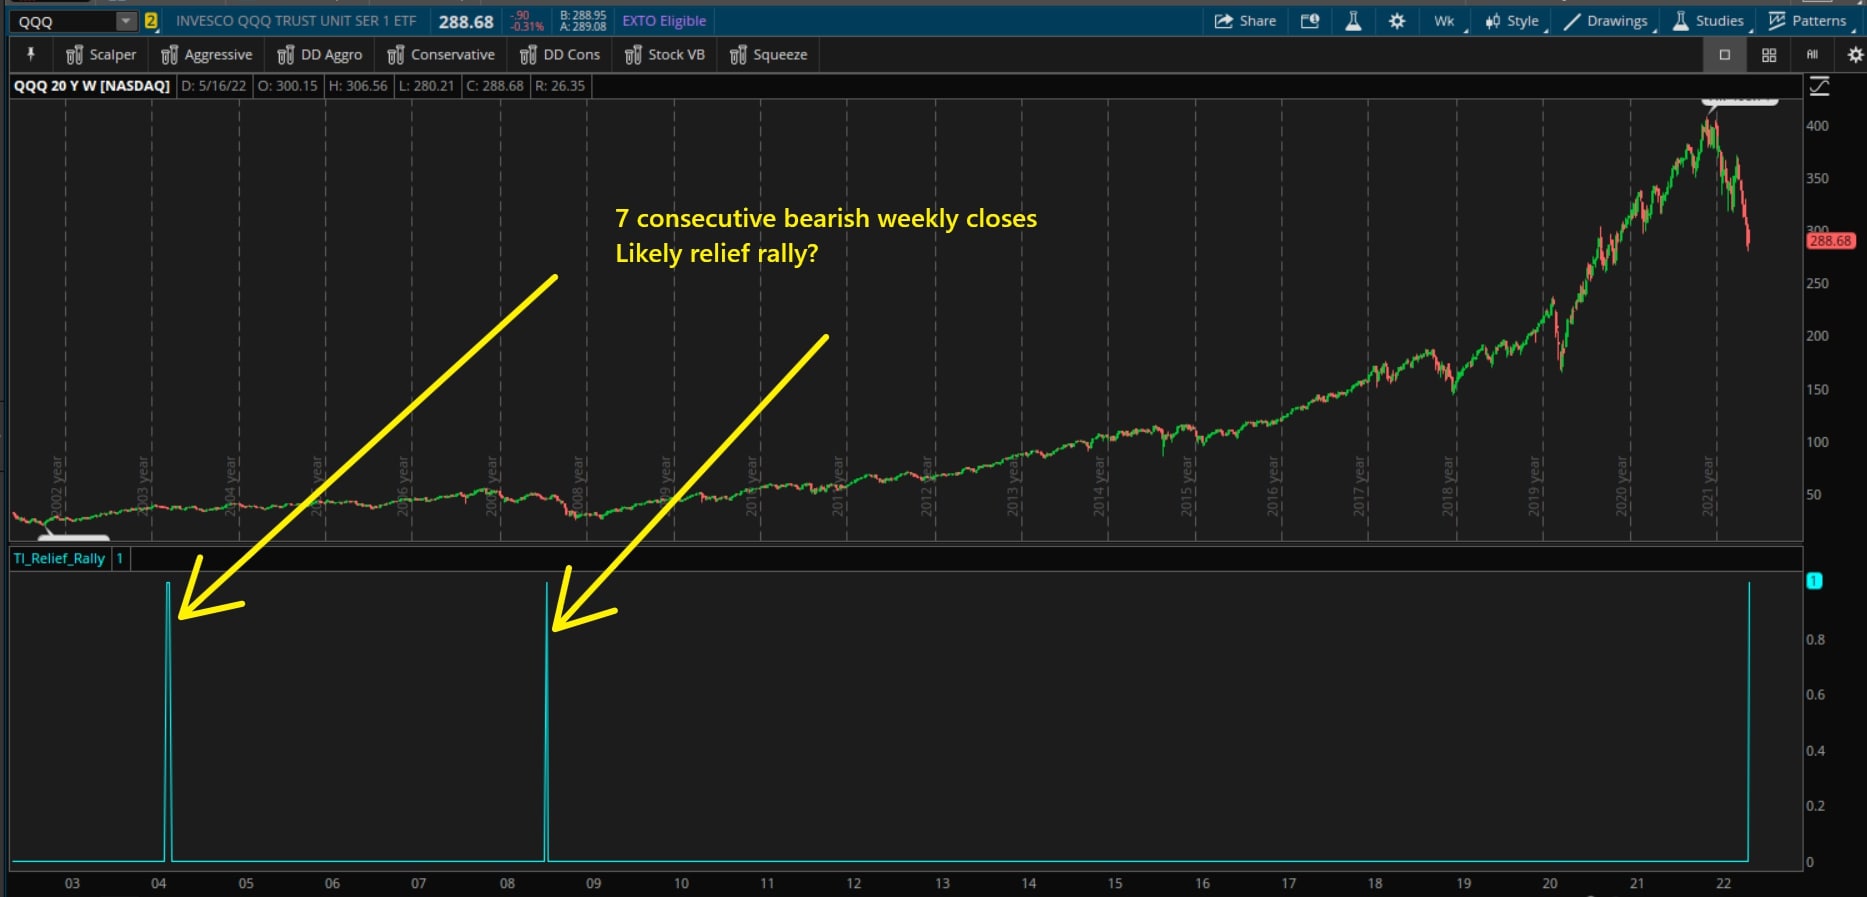
With May 20, 2022 weekly candle’s close, we officially have 7 bearish weekly closes inside of the major index markets, including the S&P 500.
Let’s put on our research glasses, and take a look to see when this has happened before, going back to 1999. Do we typically see the selling continue? Or, do we see a relief rally instead?
Here’s the thinkScript code that we can use, to perform this query:
def bearishCandle = close < open;
plot reliefRallyTest = Sum(bearishCandle, 7) >= 7;
As a study on a weekly time frame charts, this will plot 1 (or true) only when we have 7 weekly candle closes in a row.

This indicator makes it easy to spot when we’ve been in a similar position previously in history.
For the 4 major index markets, here’s a summary:
| S&P 500 | DOW JONES | NASDAQ | RUSSELL 2K | |
| Current | 7 | 7 | 7 | 5 |
| Historical | 1 | 0 | 4 | 9 |
| Relief Rally | 9 | 0 | 3 | 6 |
Conclusion
In conclusion, bear market relief rallies can present good opportunities for investors to make profits.
Key takeaways:
- It is important to be patient and wait for the market to show some signs of stabilization before entering any trades.
- Once the market starts to move up, you can start looking for stocks that have good fundamentals and are trading at attractive prices.
- Remember to have a plan for your trade and to be disciplined with stops, entries, and targets.
For those that would like to apply a similar analysis on individual stocks, you can use the thinkScript code above, and modify for the appropriate number of bearish weekly closes.
Happy Trading!
Here are useful links for the indicators mentioned in the video:
- Futures Volatility Box
- Stock Volatility Box
- Edge Signals indicator (Free for Volatility Box members)
