5 Oversold Stocks With High Short Interest – Part 1
Video Transcription
I’d like to go through a list of oversold stocks that have a high short interest. We’ll go through the entire process of how to run the scan, how to find short interest, all that good stuff.
First, let’s start with the S&P 500.
The reason why we’re looking for this scan is we had a bit of a pullback last week or at least over the past two weeks almost. With the pullback, we’ve tagged the line we were looking for – that was the 1.272% Fibonacci extension.
We had that at $371.94, which was the area we were looking to tag, and then bounce from. The candle on Thursday came all the way down to $371.88. Fairly, close.
And so far we have a bounce from there.
If you’re working with the idea in mind that we’re looking for this existing bullish trend to continue resuming, then this is a decent spot to expect a bit of a bounce from.
We’ve got that perspective, and now we’re going to dive a bit deeper looking for oversold stocks. That helps to narrow down our focus.
Then, we’ll narrow it down even further, looking for stocks with high short interest. Our goal is to find the stocks that are most likely to take advantage of any kind of bounce in the markets here, with exaggerated moves.
Scan for Oversold Stocks: 1:13
Let’s start first with running the scan. I’ll come into our scan tab for all of our Volatility Box members. I’m running the Edge Signal scan with two other fairly simple criteria. The ending volume had to have been 500,000 or greater and our bid price has to be greater than $10.
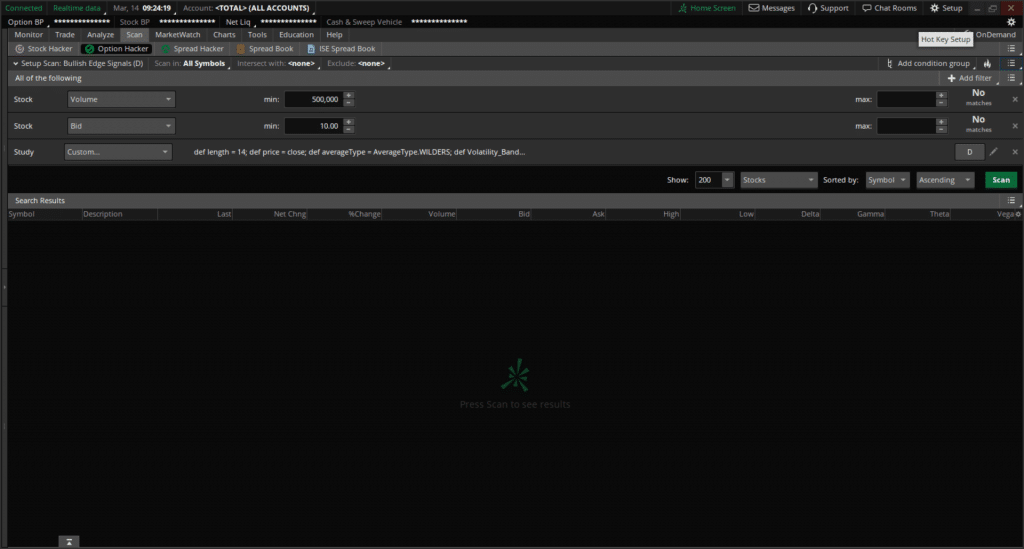
Once we run the scan result you’ll notice we have 212 results.
I will copy all of these stocks and come into an Excel sheet here. Here, we can paste in this list and create a comma-separated list by using the formula:
=b1&","Now I apply that formula to all of the cells.
And voila! We have a comma-separated list of all of the stocks that currently have an Edge Signal as of Friday’s close.
Short Interest Scanner: 2:00
Now, let’s load in our Short Interest Scanner. I’ll paste in the entire list. Let’s sort by highest short interest to lowest, and you’ll notice at the top of the list, we have:
- ESPR
- FIZZ
- RVLV
- TWNK
- RRC
- KNSA
- MTZ
- APLS
- and others
We’ll look at all of the stocks with short interest that is greater than 10%.
Candidate Criteria: 2:25
Our entire goal with going through charts is to try and keep this as quick as possible.
We’re checking to see if:
- Most recent Market Pulse is green, suggesting that we have an overall uptrend
- At least an Edge Signal plotted
- Slingshot Squeeze or Squeeze Signal plotted = additional bullish bias
With those rules in mind, let’s start reviewing the charts, looking for stocks that could bounce higher.
Chart Review of All High Short Interest Stocks: 2:50
Starting with the very first stock in our list – ESPR. ESPR does not meet our first criteria. Our Market Pulse most recently is red. You can also see that with the labels right here, which aren’t lit up green.
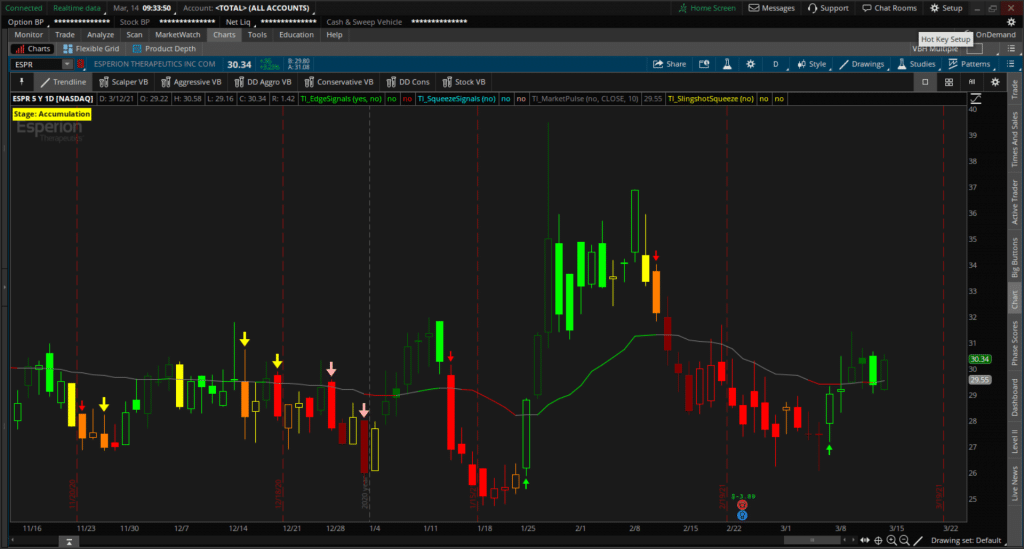
Let’s keep coming down the line, the next one is FIZZ.
We load in FIZZ on the daily time frame. The only one thing I’ll point out on FIZZ, just for people who are looking at it on the weekly chart – you’re still in an overall uptrend, BUT FIZZ doesn’t meet the rules that we’re looking for.
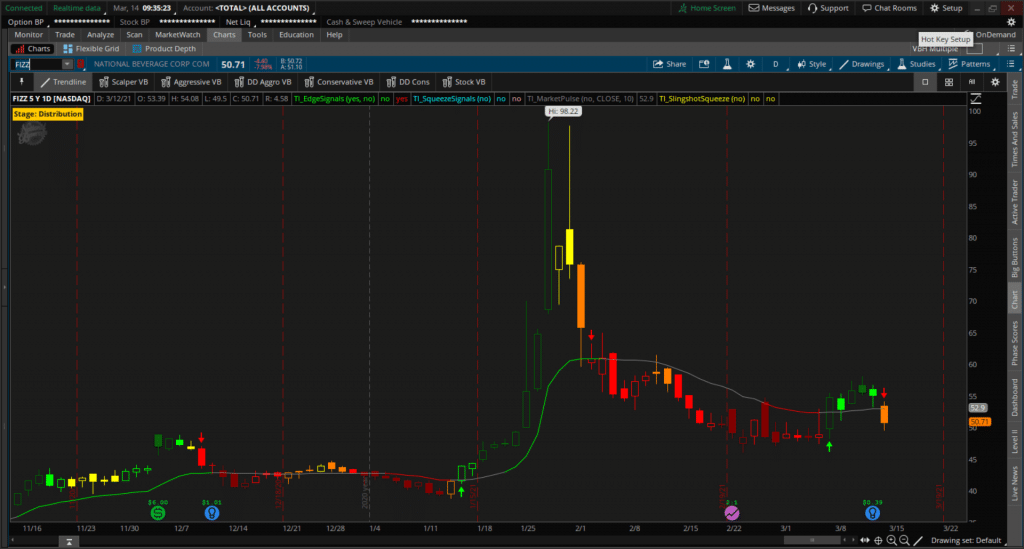
Skip.
Let’s keep moving forward, we have RVLV.
In Revolve Group, we have a Squeeze Signal. We also have a bit of a pullback to the Market Pulse line, which was confirmed on Friday with a pretty nice bounce up, ending the day positive.
We’re looking at RVLV to continue the same bullish trend, and look for the squeeze to eventually fire, and take us beyond the $50.89 zone.
The one thing I don’t like about this from a technical setup is the squeeze histogram bars here.
They are already looking like they’re at levels which you would see typically after the squeeze is fired. That’s the one ding against it if we check this on the weekly time frame chart as well weekly time frame also looks like it’s starting to ramp up higher.
[After Trade Edit] Here is RVLV, after the nice bullish move:
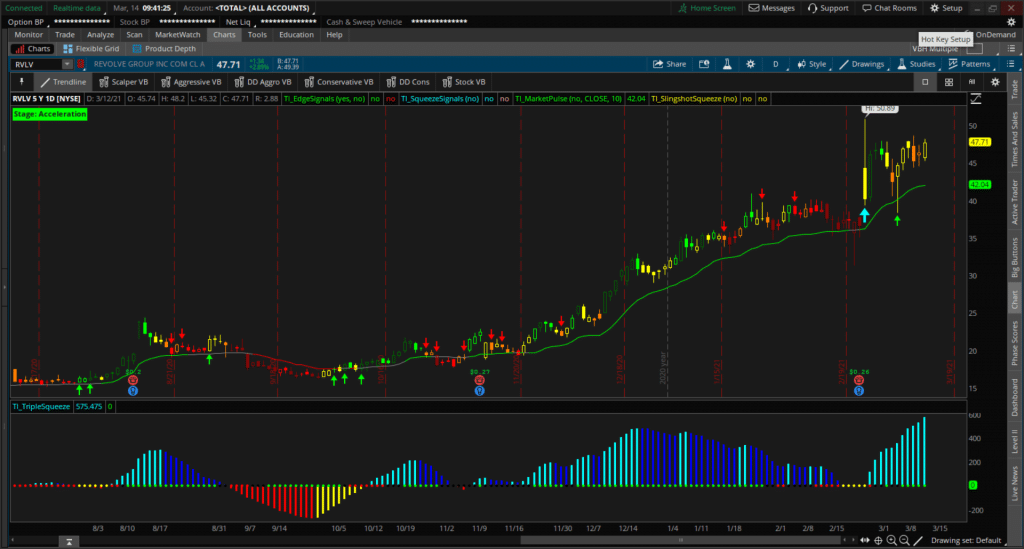
The one other thing that we can add to our charts, before we move on is Relative Volume Standard Deviation. Using the indicator, we’ll see we had a recent high volume day, with a pretty nice bullish move to $225. Since then, the volume has been fairly muted.
We have RVLV so far that looks fairly interesting.
Let’s move on to Hostess Brands (TWNK), which also looks fairly interesting.
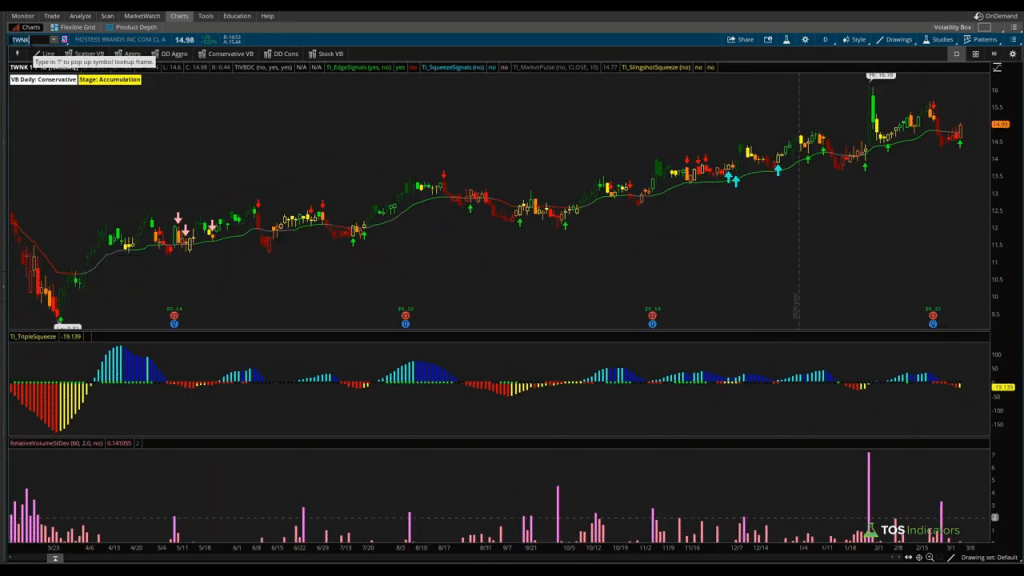
We’ve held the Market Pulse line so far. The Triple Pro Squeeze looks like it’s starting to increase momentum. That’s just been price chopping around the Market Pulse line for the most part.
We have bullish signals, and an overall uptrend so TWNK would be another stock to add to our list of oversold stocks with high short interest.
Let’s move on to RCC, it also looks fairly interesting.
We have an overall bullish Market Pulse. We have the most recent bullish Edge Signal also confirming this. The Triple Pro Squeeze looks like it’s also fired on the weekly time frame chart- A few more bars of positive movement could support this overall daily squeeze firing as well.
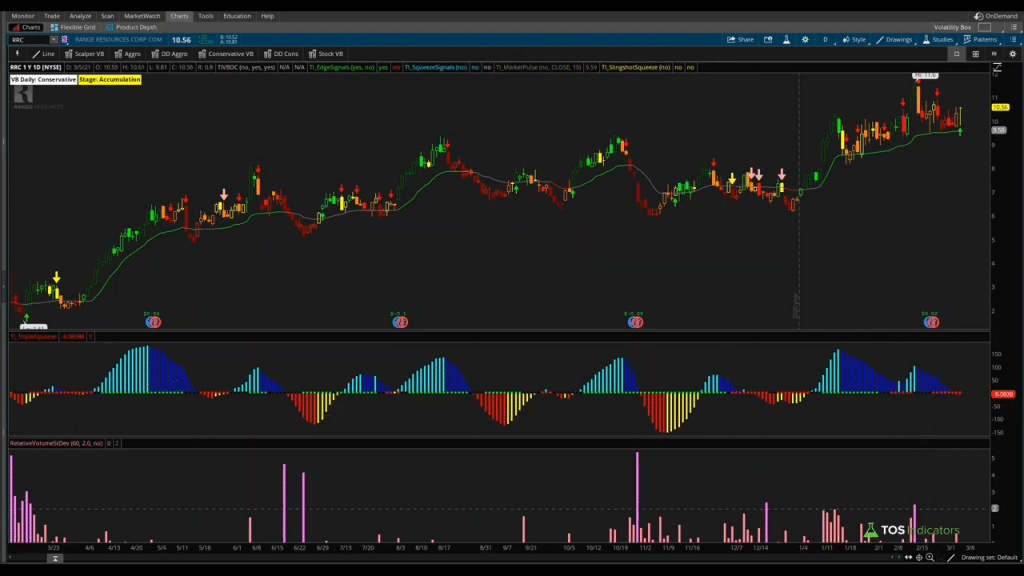
We’ll add RRC to the list.
Let’s actually create a new list here. We have the following stocks so far:
- RVLV
- TWNK
- RRC
Next up, we have KNSA.
We have a Slingshot Squeeze on a squeeze that has yet to fire – instead, it’s just been building momentum. We’re headed back up from negative momentum territory. We have the Edge Signal confirming this.

So far, we’ve held the Market Pulse line, this would be another interesting one to add in. Not sure how I feel about a pharmaceuticals company, but it does have high short interest.
Our entire goal here is to just create a list.
We keep coming down the line we have MTZ and APLS next. Let’s go through the last two.
MTZ looks interesting. We also have the Squeeze Signal. I would give MTZ bonus points almost. Let’s add it to the list.
We had APLS, BHVN, CPB, and RUBY left. Our Market Pulse is most recently red on all of these stocks, so we can skip them.
5 Oversold Stocks With High Short Interest Stocks: 6:50
We have a list of five stocks.
These are five stocks that have our focus for this upcoming week. They are five stocks in which we have the Edge Signal. That means these stocks are officially in oversold territory.
We also have high short interest, which means we have some sort of a tailwind looking for movement up, that can be ridden with momentum.
Finally, we have MTZ at the top of our list also one with the Squeeze Signal which is another reason why we’re looking for that same bullish momentum to come through.
How to Use This List of Oversold Stocks: 7:18
The list that we’ve built in this video of oversold stocks with high short interest gives you several different trade opportunities.
- Bullish trend setups on intraday time frames – for Volatility Box members, this means a Slingshot Squeeze or Squeeze Signal on a 1m time frame chart, with a bullish Market Pulse.
- Bullish fade setups on intraday time frame, using the Volatility Box for reversal zones
- Bullish pullbacks on the daily time frame chart.
Our tools help to make this process much more automated but you can also go about it doing it in a much more manual approach, if you’d like.
The end goal is the same – find a list of stocks every Sunday, that you’d like to focus on for that week.
