
Futures Trade Reports
Focused on 10 futures markets (including indices)
cATEGORIES
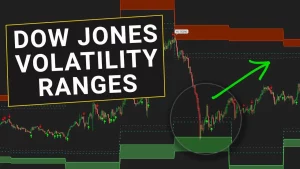
This is Why the DOW Stood Out Today
Today’s sell-off triggered a long-side volatility setup in the S&P 500, DOW and Nasdaq. The DOW very clearly stood out – it gave us an edge for this long entry, good for +62 points.
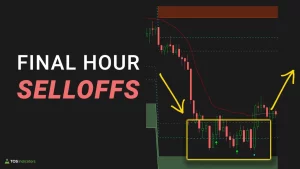
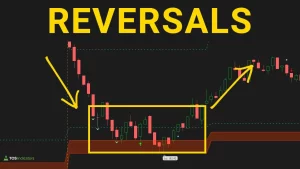
The Closing Bell Selloff Inside the DOW Futures
Let’s walk through an example of a day trading setup in the DOW futures, during the final hour of the market. The setup was a long side entry, as price fell into our Volatility Box zones.
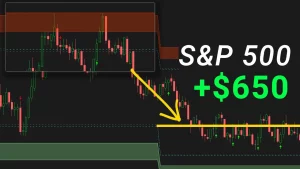
Friday Volatility in the Index Markets
We had a volatile close to end this trading week, something we aren’t typically used to seeing. Let’s dig deeper to see how a volatile Friday translates into day trading setups.
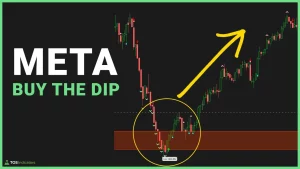
Volatility Comparison – NASDAQ vs. META Stock vs. NVDA Stock
Compare and contrast the volatility in the Nasdaq futures market, with the volatility inside of two large cap stocks (META and NVDA).
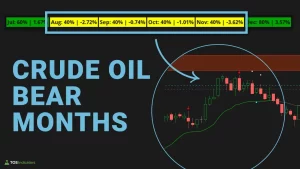
Crude Oil Seasonality Idea Update
This video is a brief update on the 4 month seasonal pattern in Crude Oil. You can find Part 1 of this video here: https://www.youtube.com/watch?v=v17ftfs5voc
PEP Stock vs. NASDAQ Futures
Compare and contrast the volatility in the Nasdaq futures market, with the volatility inside of two large cap stocks (INTC and PEP).
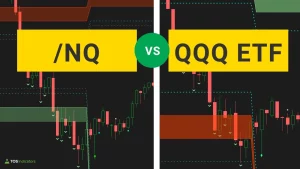
Futures vs. Stock Volatility Models (NQ vs. QQQ)
I’ll show you the differences between the Futures Volatility Box and Stock Volatility Box models and levels.
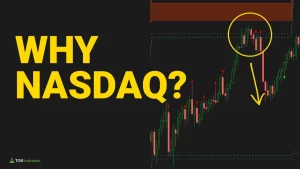
NASDAQ’s Unique Volatility Edge
We’ll review all 4 index markets, and walk through the unique volatility edge that the NASDAQ provided for day trading.
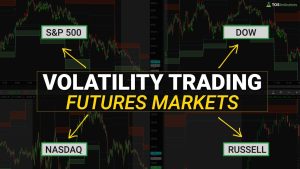
Volatility Day Trading – S&P 500, NASDAQ, DOW, and Russell 2K
A step-by-step process you can follow to understand and profit from volatility in the 4 major index markets.
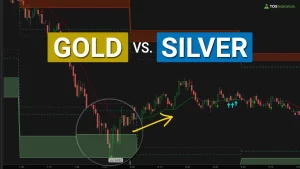
Volatility Breakdown: Gold vs. Silver
Let’s compare volatility in Gold (GC) and Silver (SI) to find any clues we can spot to use for day trading. The same techniques can be used on the micro-futures equivalent as well.
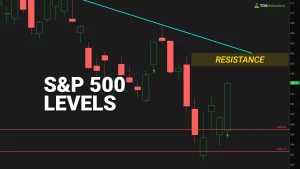
S&P 500 – Fibonacci Levels Update
A quick update on the S&P 500 Fibonacci Levels that we have been tracking in this most recent sell-off, along with a game plan of what we need to see for our bias to reverse.
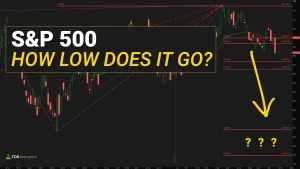
How Low Can the S&P 500 Fall?
We’ll use Fibonacci extensions in our current bear market to project downside levels, if the S&P 500 continues to keep falling.
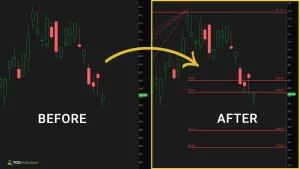
S&P 500 Fibonacci Retracement Levels (Feb. 2023)
Start with a blank chart of the S&P 500, and learn how to mark it up from scratch using a Fibonacci Retracements and price channels.
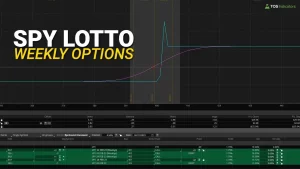
SPY Lotto Butterfly Idea
In today’s video, I’ll share a lotto trade idea in SPY, which is targeting a move to the Market Pulse line, and a bounce from the shorter term trend channel.
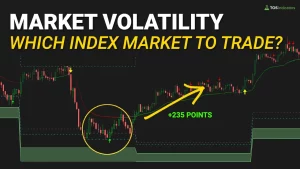
Market Volatility and Impact on Individual Index Markets
We’ll review the overall market’s volatility from this morning, when we had the S&P 500, DOW, Nasdaq, and Russell all break key volatility zones.