
Trading AAPL Stock Using Option Chain Clues
In yesterday’s Daily Trade Report, we created a game plan for trading Apple (could trade AAPL stock or options) that involved the following:
- Trigger: If AAPL > $294.18 in the first 15-30 minutes of market open, then start to look at AAPL as a likely trending candidate
- Target: Our closest magnet price in AAPL stock is $300. An overlap with the $300 price and a Volatility Box edge level would be ideal.
- Stop: Previous pivot low and/or Volatility Box level overlap (see link above for example)
For today’s video, we dive a bit deeper into AAPL stock’s option chain.
With today’s trading activity, AAPL stock stayed relatively muted with regards to price action, with a total plus/minus fluctuation of 1.16% which took place in the first six minutes of trading.
After that initial burst, AAPL stock stayed within the morning clearing range hours (6:30-7am PT). Towards the end of the day, AAPL stock made one last push up hgiher, ending the day +$2.13 (0.73%).
We’ll continue to monitor AAPL stock after hours, and look at using the same levels to build a similar trade to our $300 price target.
Analyzing AAPL Stock’s Options Chain
We’ll start by taking a look at AAPL stock’s option chain, with a focus on the upcoming weekly options that expire on 3 Jan 20, along with the January monthly options that expire on 17 Jan 20.
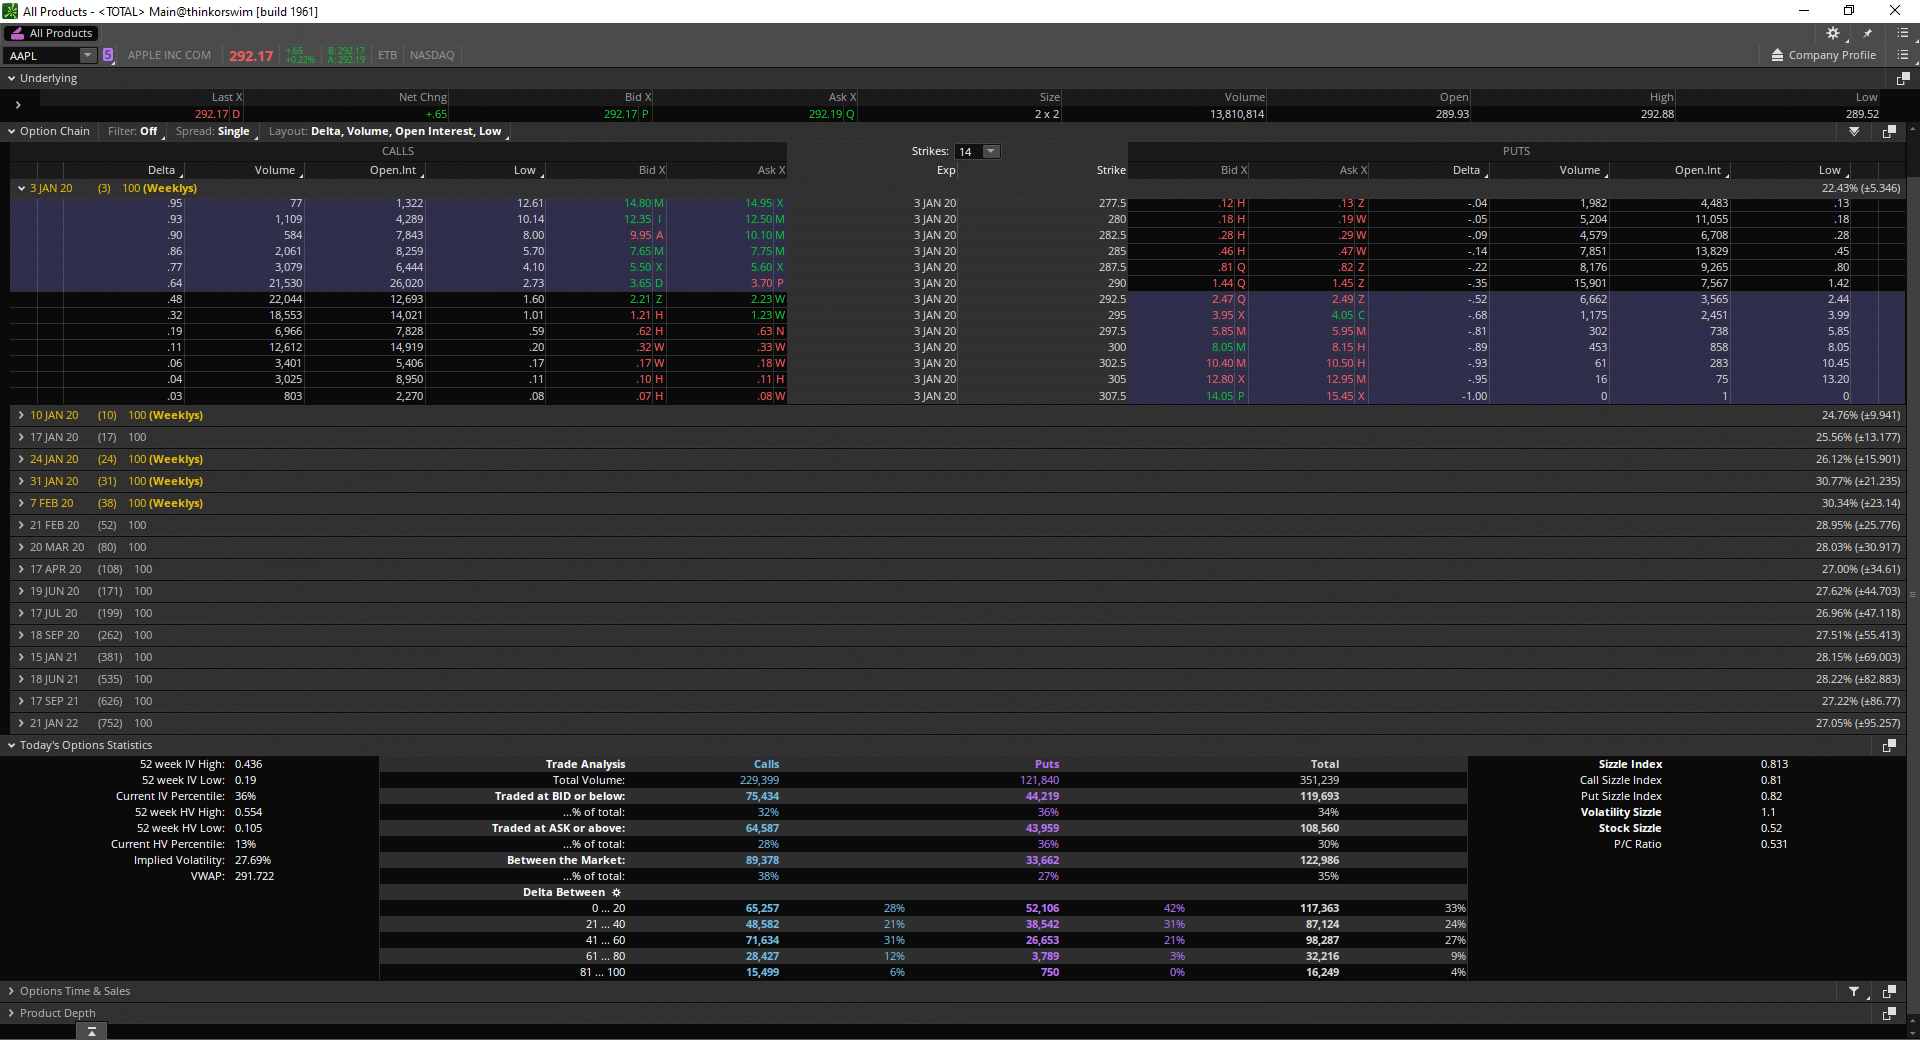
For those using options trading strategies to play this move, below are some option statistics on AAPL that may help in making call/put strikes:
- Current Highest Weeklies (3 Jan 20) Open Interest Call Strike: $290
- Probability of $300 Strike Weekly Options Expiring ITM (3 Jan 20): 13.91%
- Current Highest Monthlies (17 Jan 20) Open Interest Call Strike: $260
- Probability of $300 Strike Monthly Options Expiring ITM (17 Jan 20): 32.43%
- Current IV Percentile: 36%
- AAPL Calls: 29% of calls traded today were between delta of 41-60
- AAPL Puts: 49% of puts traded today were between delta of 0-20
Using the above ThinkOrSwim options data, we can derive a likely hypothesis that traders are buying ATM call options and/or selling far OTM put credit spreads, to trade a move up to $300, with relatively low risk.
However, as of today’s option activity, the $300 strike does not have the greatest open interest on the weeklies option chain for this expiration cycle – the $290 strike does.
The Jan Monthlies (17 Jan 20) go even deeper into ITM options territory. Our current strike with the highest open interest is $260. It is possible that these were leaps, especially considering the January options chain, and may explain the higher number. It is something to point out, however – as we’ve seen occurrences where open interest acts as a magnet.
Measuring AAPL Stock Using V-Score
For us – we’ll be looking at using our trigger as a signal to see if we can get a move up to $300 within the week, else re-visit the trade next week, being cautious that $300 may act as break out resistance, and cause AAPL to plummet shortly after to near the $260 strike area.
Focusing on AAPL stock in particular, we have been spending quite a bit of time in the 2 standard deviation ($275.91) to 3 standard deviation ($311.15) territory using our V Score on the daily time frame chart, suggesting a potential reversion back to the mean, or the 1 standard deviation ($240.67) to 2 standard deviation territory.

Using a weekly time frame chart, AAPL looks to be approaching the 3 standard deviation level, which is $301.33, and happens to overlap close to the magnet level of $300.
With the last day of 2019 in the books, the SPY rallied, bringing its annual gain to 29%. To contrast that, Apple rallied +106% from our December 2018 lows. Apple outperformed the market by nearly 3.5x.
Happy New Year!
Start trading with an edge, at the edge, and sign up for the Volatility Box today