Posts Tagged ‘swing trades’
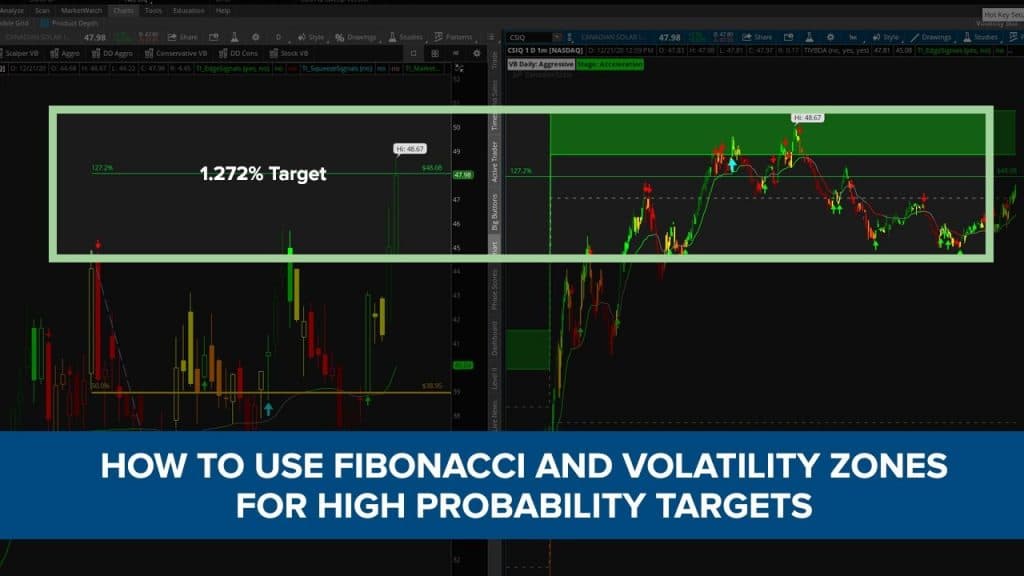
How to Use Fibonacci Extensions and Volatility Ranges for Trade Targets
Video Transcription Today’s video is all about how you can easily use the Fibonacci extensions tool along with our Volatility Box to get high probability target zones from which you expect price action to start to reverse. Now for today’s example, we’re going to be focusing on Canadian Solar (CSIQ) and the reason why I’m…
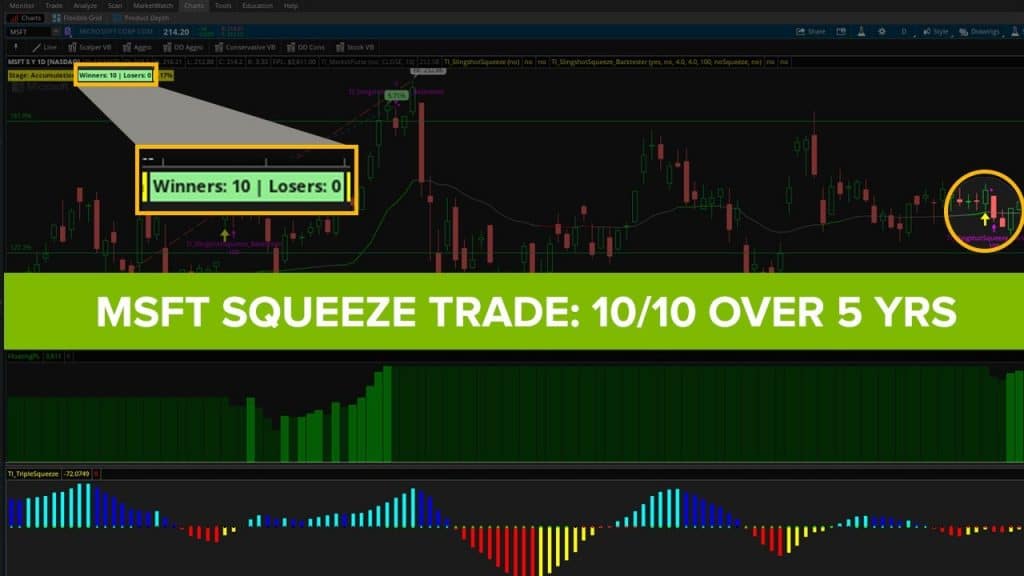
Read MoreSqueeze Trade Setup in MSFT That Hasn’t Lost in 5 Years
We’ll discuss a squeeze setup on Microsoft that has triggered 10 times in the last 5 years, and has been a winner all 10 of those times.
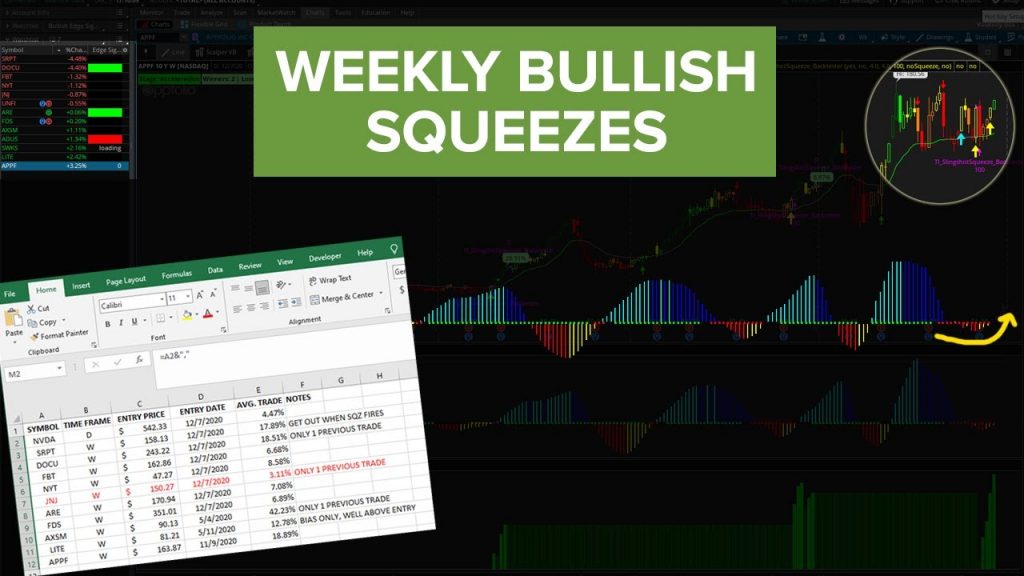
Read MoreBuilding a Watchlist of Weekly Time Frame Squeezes
In today’s video, we’ll use the new Slingshot Squeeze scan and backtester to find profitable weekly time squeeze candidates.
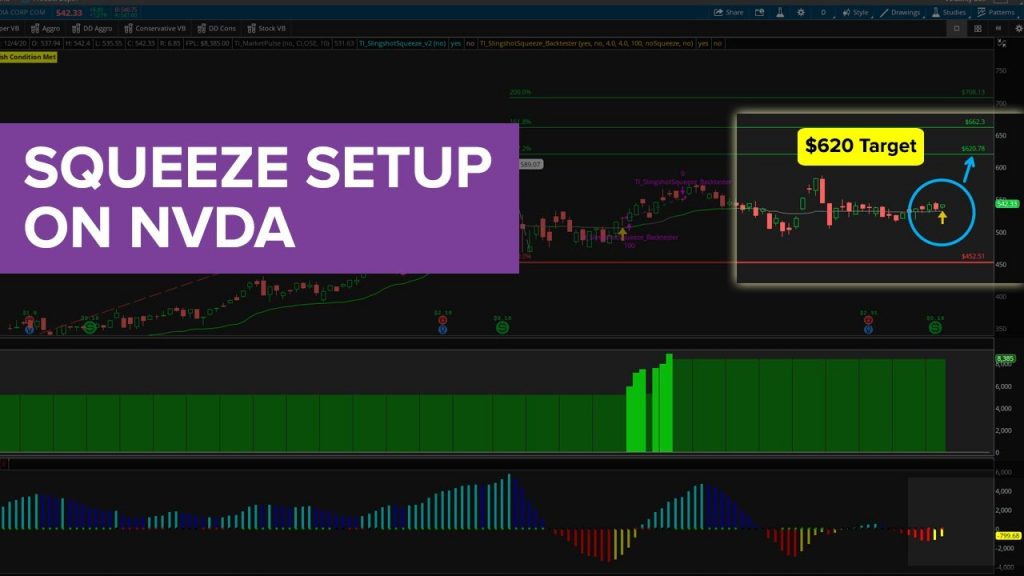
Read MoreBullish Daily Squeeze Setting Up on NVDA
In today’s video, we’ll use the new Slingshot Squeeze scan and backtester to
backtest a squeeze in NVDA.
With the backtester, we see that we’ve had 8 bullish squeezes in NVDA, over the past 5 years. With the 8 bullish squeezes, 7 of those have been winners, and 1 was a loser (albeit, a fairly painful loser).
On average, we see that each of the squeeze moves have led to anywhere from a 6-8% move in NVDA from the point of entry. From our current price of $542.33, that takes us to right around
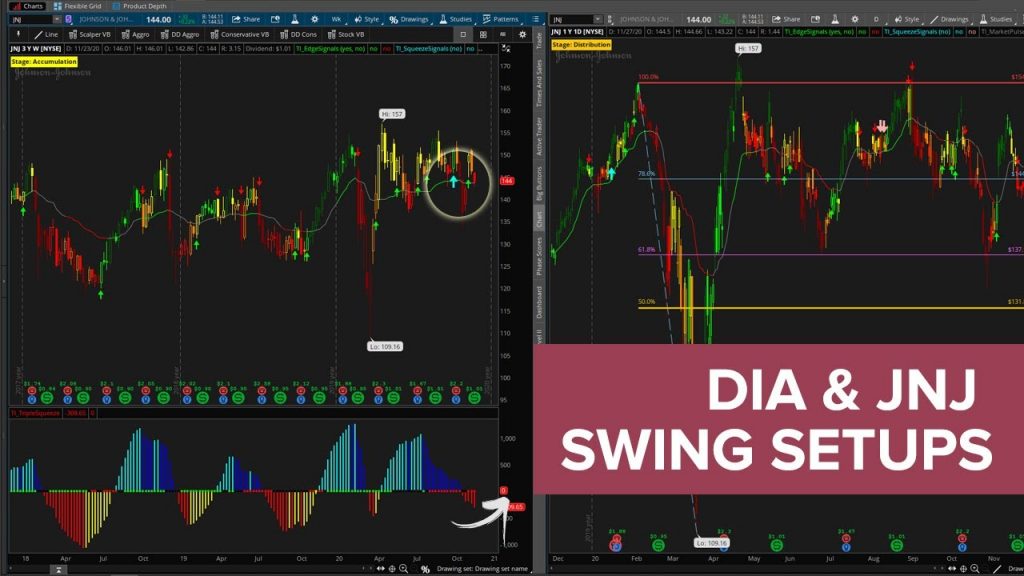
Read MoreDIA and JNJ Trade Triggers (and DDOG/TSLA recap)
We’ll do a review of the swing trades in DDOG and TSLA which have hit their first set of targets, along with set up a new trade in DIA.
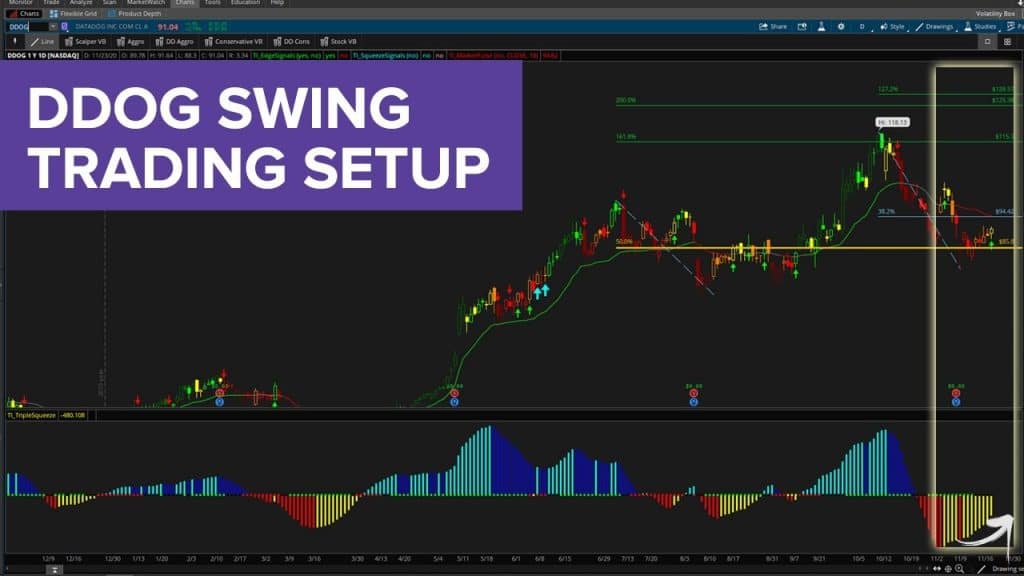
A reminder as to the idea behind DDOG: https://youtu.be/ZStu8iHr46E
-We had a pullback on the weekly time frame chart to DDOG’s Market Pulse line.
-We also had a bullish Edge Signal (oversold) confirmation signal on the daily time frame chart.
ENTRY: $91.04 (Filled)
TARGET 1: $94.62 (Hit T1)
TARGET 2: $100 (Open)
TARGET 3: $115.30 (Open)
TARGET 4: $125-$1
Swing Trade in DDOG and Day Trades in S&P 500
We’ll discuss a swing trade setup in DataDog (DDOG), along with breaking down some of the day trades in the S&P 500 (along with one setup for tomorrow).
Starting off with DDOG, we have a pullback on the weekly time frame chart to our bullish Market Pulse line. In addition, we also have a bullish Edge Signal (oversold) confirmation signal on the daily time frame chart.
Here’s the trade parameters for the extensions discussed in the video, along with 4 potential targets depending on how long y
Read MoreTSLA Broken Wing Butterfly Trade Idea
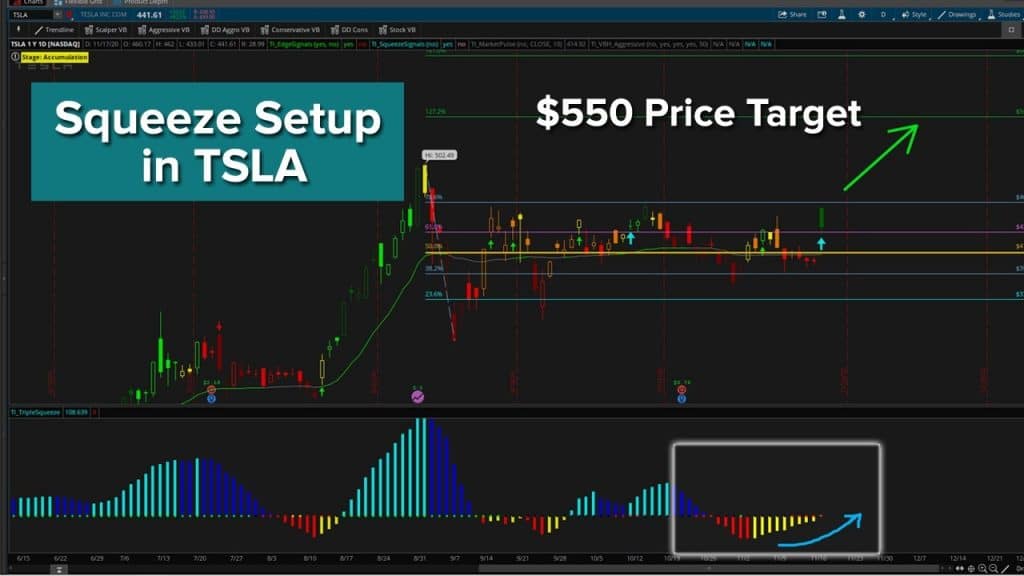
With the news of Tesla (TSLA) being added to the S&P 500, we have a catalyst to support a bullish trade idea looking for a move to the 1.272% Fibonacci extension.
We have a squeeze that has been gaining momentum, leading to the idea that it will fire long. To play this move in a relatively “expensive” ticker, we’re going to build a broken wing butterfly.
The broken wing butterfly gives us 2 inherent benefits:
1. No upside risk
2. Reduced cost compared to owning the shares outright, or buyi
3 Different Trade Setups in Boeing (BA) Stock
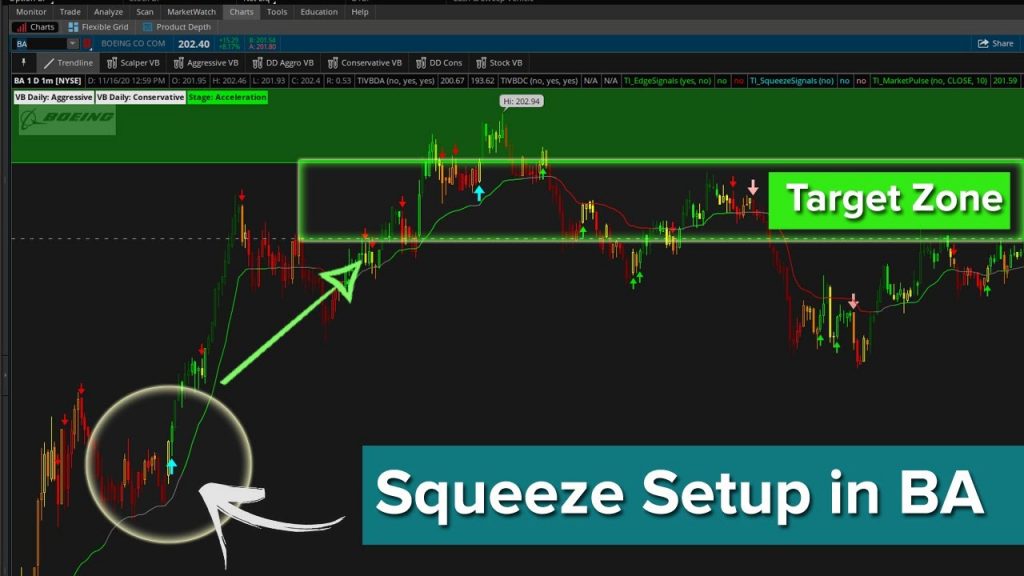
We’ll discuss 3 different types of trade setups that occurred today in Boeing (BA), giving you an opportunity to visualize and understand each one.
The 3 trade setups that we’ll discuss are:
1. Bullish Squeeze and Targets
2. Reversal via the Volatility Box
3. Trending Criteria for Tomorrow
In the first setup, we had a bullish Squeeze Signal along with a bullish Market Pulse, suggesting that we expected the stock to continue trending bullishly. Here’s a video detailing that setup in more detail
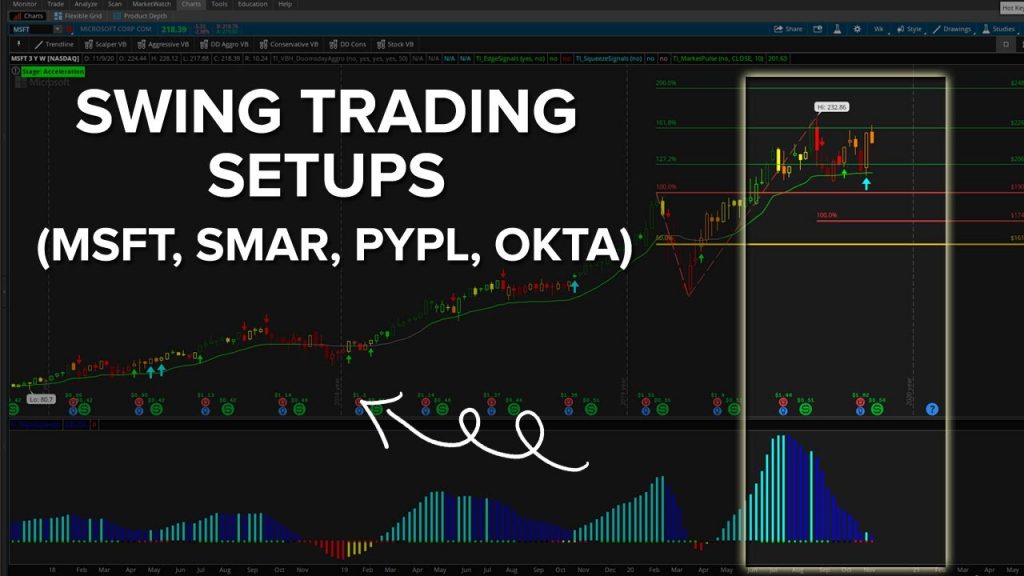
Read MoreSwing Trading Setups (incl. MSFT, SMAR, PYPL, OKTA)
In today’s video, we’ll use today’s sell off to see where we have longer term, swing trade opportunities setting up.
We’ll use our Squeeze Signals scan (built as part of our Squeeze Course), and take a look at the setups using a weekly time frame chart. For those with access to the course, you can also use the backtester here to see actual P/L results.
With a weekly time frame chart, we have opportunity for better trading entries, and maintaining a longer term perspective. Many of these weekly
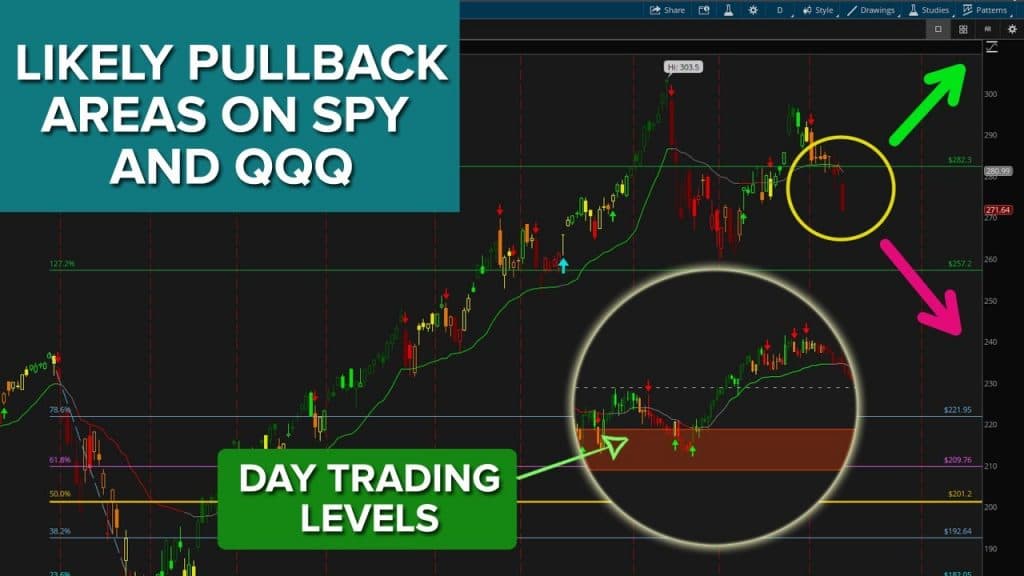
Read MorePullback Levels on S&P and Nasdaq
With today’s selling pressure, supported by high volume, we’ll take a look at potential pullback zones in the S&P 500 (SPY) and Nasdaq (QQQ).
Using Fibonacci, we see in the Nasdaq that we’ve hit the 1.618 extension, and are now pulling back. With the S&P, we have open gaps below us, which look like they are likely to be filled.
In case you’re interested, you can also replicate the same process that we use in tonight’s video on the DOW and Russell as well, for pullback zones.
After discuss
Read More
