
Volatility Box Trade Examples
Volatility models to help you trade stocks and futures like a seasoned professional
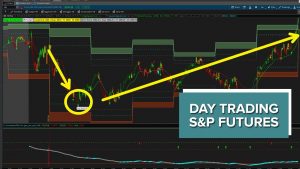
Buying the Dip in ES, YM and NQ Futures
The election volatility in the S&P 500, DOW, Nasdaq and Russell markets continue, with day trading opportunities setting up.
Today, we had an opportunity to buy the dip in the ES, YM and NQ futures. Similar to yesterday, there were 2 winners and 1 loser.
P/L (2 contracts):
1. S&P 500 (/ES) Futures: +24 points, +$1,200
2. Nasdaq (/NQ) Futures: -50 points, -$1,000
3. DOW (/YM) Futures: +190 points, +$950
Well discuss all 3 trades that setup today, including the winners and losers.
For those
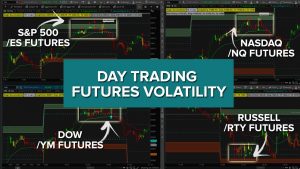
Day Trading Futures Volatility – ES, NQ, YM, RTY
We had two different trade setups trigger today, in our 4 major indices markets. With elections coming closer, volatility has been creeping back into the index markets.
Our first setup was based on the market internals, specifically the Cumulative TICK. We had our Cumulative TICK Pro indicator alert us that we should expect a trending up market by 7am PT, 30 minutes after the market open.
Using that information, the SPY 345 Call was worth $2.00 at the point of entry, and close to ~$3.19 at it
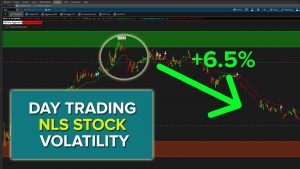
Day Trading NLS Stock Volatility (and 5 Other Stocks)
We had NLS stock hit our Volatility Box Live Scanner today, which gave us a beautiful opportunity to trade the volatility and catch the reversal move in NLS. This same setup existed for 5 other stocks as well, which we’ll discuss in today’s video.
The Live Scanner is a machine that we’ve built, which constantly keeps giving you trade ideas as they set up. The scanner usually refreshes every 15 or so seconds with any new trades that are setting up.
For today’s performance recap, there are two

Day Trading Nasdaq, DOW and Russell Volatility
The “First Hour Test” with our Futures Volatility Box typically gives us clues around what to expect for the day, especially with regards to volatility.
Using today as an example, the S&P 500 (/ES) broke outside of our Volatility Box clouds, while the DOW (/YM), Nasdaq (/NQ) and Russell (/RTY) were all contained. This was our first clue, to expect volatility in the other 3 indices to start to increase as the day progressed.
While we did not have any trade opportunities in the S&P, we did have
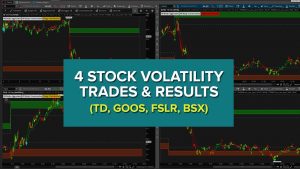
4 Stock Volatility Trades and Results (TD, GOOS, FSLR, BSX)
In this video, we’ll review the Stock Volatility Box’s performance for today, diving deeper into 4 specific trade setups.
Today, we had 23 trades that hit our Live Scanner in the first four hours (from 6-10am PT). The Live Scanner is a machine that we’ve built, which plots stock entries as they setup, with specific entry, target and stop prices.
Specifically, we’ll dive deeper into the charts of TD, GOOS, FSLR and BSX.
1. TD – Aggressive Long Trade Entry (Winner)
2. GOOS – Aggressive Long Tr
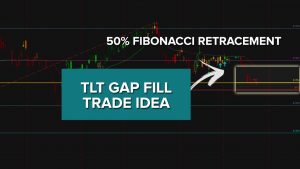
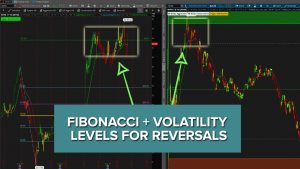
TLT Fibonacci Trade Idea (50% Retracement Pullback)
With a rather peculiar year, we’ve seen markets like TLT have a greater than average percentage gain, so far into 2020.
In today’s video, we’ll discuss a trade idea setting up in TLT, as a result of the recent gap lower. Price action is currently hovering around the 50% retracement mark, using the swing high to swing low in TLT.
Additionally, if we use a previous swing high to swing low Fibonacci retracement, we’re able to create a cluster zone. So far, price action has respected this zone,
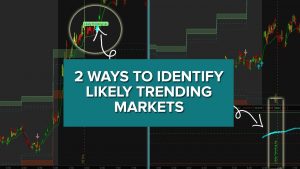
2 Ways to Identify Trending Markets
We have two easy ways to discover likely trending markets, using data-driven tools that we’ve created. In today’s video, we’ll discuss both of those methods and break them down with some examples.
Our first method of identify trending markets is built inside of the Volatility Box. We’ve used data here to identify specific price action clues in the first few hours of the market being open, to determine whether the market is likely to trend.
Today, we had Copper give us the indication that we sh
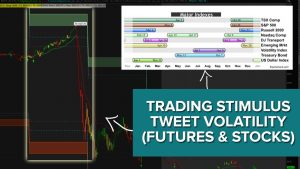
Stimulus Update Volatility – Futures & Stock Trade Setups
In today’s video we’re going to talk about the volatility we saw in the markets, as a result of Trump’s tweets, stating that stimulus negotiations were going to be pushed till post-election.
This was something the market did not expect, and we saw that reflected in the price action. Across the board, the S&P 500, Nasdaq, DOW, Russell, 30-YR Bond, Energies, you name it — almost all major markets saw a volatile reaction to this news.
This ended up becoming our catalyst for both futures and stoc
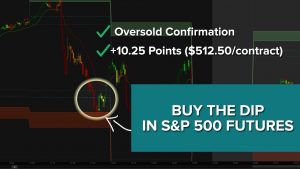
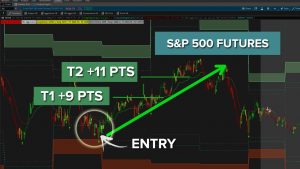
S&P 500 (/ES) – Buy the Dip Futures Setup
We had several “Buy the Dip” setup opportunities in our futures markets, towards the final few hours of the close.
Our first setup which we’ll discuss in today’s video was in the /ES (S&P 500) futures. We had an opportunity to buy the dip, and go long the /ES futures markets. This trade was good for 10.25 points in the /ES futures, which resulted in a gain of $512.50/contract.
Our second setup was in the RTY futures (Russell 2K), which was similar, but fell short of our target by 0.4 ticks. Ul
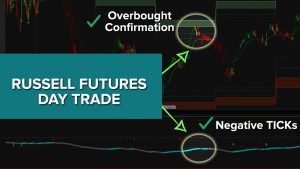
RTY Futures Day Trade Walkthrough
We’ll walk through a “picture perfect” setup in the Russell Futures (RTY), which set up today in the 9-10am PT hour.
During the middle of the east coast lunch time, we had the Russell hit our dashboard, when price action reached our Volatility Box entry lines. This gave us an opportunity to get short, once we had the Edge Signal confirmation.
In today’s case, we had several different components which supported the short:
1. We had multiple Edge Signal confirmations (our oversold / overbought c
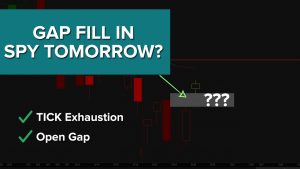
SPY Gap Fill With Cumulative TICK Data (OTM Put Debit Spread)
Similar to last week, we’re going to continue using the Cumulative TICKs to find clues around what to expect in the S&P 500 for tomorrow.
With the close today, we had our Cumulative TICK Pro indicator suggesting that we had a likely bullish trend exhaustion. Typically, this is met with a reversal the next day. We had something similar set up last Thursday, with a bearish trend exhaustion signal, and saw a nice rally to close on Friday.
We’ll use this data and observation to build a trade in S
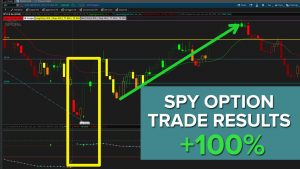
SPY Bullish Reversal Trade Results (100%+ Winner)
We set up a game plan for trades in SPY, along with the futures and stock markets via our Volatility Box in yesterday’s video. Today, we’ll take a look at the results to see what happened.
We expected for the markets to open down lower, and then start to trend bullishly for the rest of the day. This was based off of our backtesting of the Cumulative TICK data, that we did in our pro version of the tutorial (free for Volatility Box members, available here: https://www.tosindicators.com/indicato
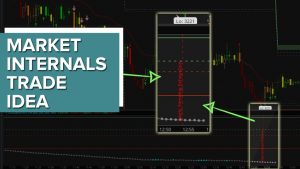
Bullish Reversal Trade Idea in SPY – Market Internals Data
The Cumulative TICK Pro signaled to us to expect a likely bearish trend exhaustion with today’s activity. We’ll use this information to create a game plan for tomorrow’s trading.
Specifically, I’m looking for the bearish trend that we had into the final hours of the market to halt, and reverse into tomorrow. Below, you’ll find a brief game plan that is expanded upon more in tonight’s video.
➡️ WHAT WE’RE EXPECTING:
A bullish reversal, after a morning decline. The Cumulative TICKs suggested t
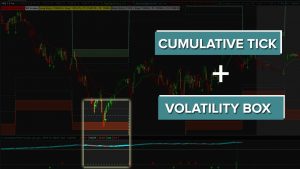
Cumulative TICK and Volatility Ranges – Day Trading /ES Futures
We had both trend and fade opportunities that set up in the S&P 500 futures (/ES), for high probability trades.
With the morning gap down lower, we had the TICKs consistently signaling selling action. This was easy to see via the Cumulative TICK indicator, with the pro version signaling that we should expect to see a likely trending down move.
Shortly after the notification at 7:00am PT, we had a pullback to our Market Pulse line, giving us a better place to start building a position with ETF
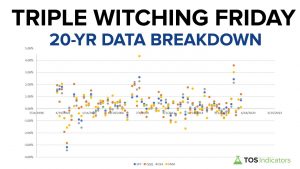
Triple Witching Friday – 20 Year Data Analysis
In today’s video, we’re going to a data deep dive into the concept of Triple Witching Fridays.
Specifically, we’ll look at 20 years worth of data, narrowing in on only the Triple Witching Friday’s, to get an idea of what we should expect, headed into tomorrow. We’ll go back to September 2000, and observe patterns, and average percent change moves in the SPY, QQQ, DIA, and IWM.
For those that are unaware, Triple Witching Friday’s are nothing more than the 3rd Friday in 4 separate months. Thes
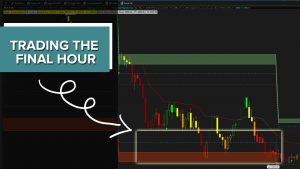
Trading Futures in the Final Hour
The final hour of the markets today gave us multiple opportunities to buy the dip, and catch some quick reversals in the indices.
We had a breach in the S&P 500 (/ES), Nasdaq (/NQ), DOW (/YM) and the Russell 2000 (/RTY). All 4 of these breaches respected our Volatility Box models, and gave some incredible reversal opportunities.
In addition to the indices, we also had breaches in Natural Gas (/NG), which was successful, along with Gold (/GC). The only market in which we went outside of our vo
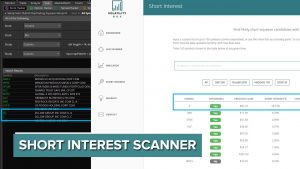
Short Interest Squeeze in Zillow (Z)
In today’s video, we’ll walk through the fairly simple process of finding high short interest squeeze opportunities.
We start by first using our Bullish Squeeze Signal scan. The Squeeze Signal is an indicator that we’ve built as part of the Squeeze Course, which helps us find stocks likely to have a momentum move higher.
Next, we’ll copy all of those stocks directly from ThinkOrSwim, and paste them into an Excel sheet. We use this formula to then comma separate the list:
= A1&”,”
After applyi
Cumulative TICK Indicator with Volatility Ranges
Over the weekend, we released our 21st episode of the “How to thinkScript” series, which includes both a free and pro version (which is available for Volatility Box members).
In today’s video, we’re going to use the Cumulative TICK Pro indicator, alongside our updated Volatility Box models to take a look at price action in the indices.
Across the board in the ES, YM, and NQ, we had breaches of our Volatility Box in the 10-11AM PT hour that hit our Volatility Box zones, almost to perfection.
Stock Volatility Trades in NVTA, SPY and QQQ
In this video, we’ll review the Stock Volatility Box’s performance for today, as well as dive deeper into the charts of NVTA, SPY and QQQ to look at 3 specific setups.
With the recent burst of volatility, we’ve seen more stocks hit our Live Scanner compared to usual. The Live Scanner is a “machine” that we’ve built, whose job is to update every 15 seconds with new trades that breach our Volatility Box edges.
Today, we had more than 229 trades that hit our Live Scanner over the course of the

Trading Daily and Hourly Volatility Levels on Indices
After 3 days of breaking outside of our most conservative models, we saw price action start to stabilize just a bit.
In today’s video, we’ll layer on both our hourly and daily volatility ranges to look and trade the indices. We sent out the daily volatility ranges, part of the Stock Volatility Box platform, to all of our Futures VB members as well, which ended up triggering for some nice trades across the board.
Via our Futures VB levels, we had a total of 7 trades, with a net P/L of +$1,410,
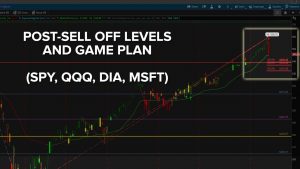
Sell Off in the Markets – Trigger Zones to Monitor
We had a relatively sharp sell off in the markets today, with many markets breaking outside of even our most conservative volatility models in the 7-8am PT and the subsequent hour.
We had all of our major indices markets break outside of our Doomsday Conservative Volatility Box clouds (ES, YM, NQ, and RTY), along with markets such as the 30-YR Bond, Gold, and Silver (ZB, GC, and SI). While that led to a challenging day in day trading the futures, it’s important to also take a step back and asse