
Daily Market Reports & Trade Ideas
In-depth market analysis, trade setups, and actionable insights updated regularly. Filter by instrument, category, or search for specific topics.
New This Week 3 videos
 New
New
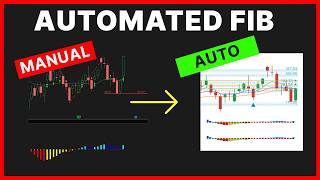
New Squeeze Feature and Philip Morris (PM) Trade Update
The squeeze has fired on 4/5 time frames inside of Philip Morris, but the behemoth squeezes still remain. I'll share an update on the trade, and congrats to those who took profits. We also released a new feature for the Squeeze Setups platform, making it easier to see support and resistance zones to catch pullbacks like the one in PM with more confidence. Here are all the links mentioned in today's video: ➜ Volatility Box: https://www.volatilitybox.com ➜ Squeeze Setups: https://www.squeezesetups.com ----------------------------------------------------------- ⏱️ Chapters: 0:00 - PM Update 0:45 - Fibonacci Symmetry 1:05 - New Feature 2:05 - Looking for New Trades 2:45 - Summary ----------------------------------------------------------- ✅ Squeeze Setups Scanner: https://squeezesetups.com/pricing/ ✅ Squeeze Backtester: https://squeezesetups.com/backtester/ #daytrading #volatility #stockmarket
 New
New
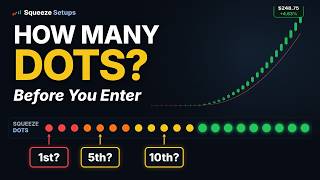
How Many Squeeze Dots Is Enough? I Tested 822,381 Trades
How many squeeze dots should you wait for before you take the trade? I ran every squeeze across 615 stocks and 22 years of data, and simulated entering at every dot depth, dot 1, dot 2, dot 3, all the way to 20. That is over 800,000 entries. On its own the dot count looks like pure noise, the win rate barely moves. But split it by one thing you already have on your chart, whether the moving averages are stacked, and the answer completely flips. Here are all the links mentioned in today's video: ➜ Squeeze Backtester https://www.squeezesetups.com ----------------------------------------------------------- ⏱️ Here are video timestamps that might come in handy: 0:00 The unanswered question 1:25 The coiled-spring belief 2:21 How I tested it 4:02 The data set 4:32 Dots look like noise 5:18 Split by the trend 6:23 One signal, not two 7:18 Edge, not a hedge 8:41 What to actually do 9:54 The one takeaway ----------------------------------------------------------- ✅ Squeeze Setups Scanner: https://squeezesetups.com/pricing/ ✅ Squeeze Backtester: https://squeezesetups.com/backtester/ #daytrading #tradingstrategy #stockmarket #backtesting
 New
New
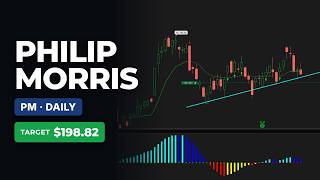
Philip Morris (PM): 3 Reasons This Squeeze Is On My Radar
A new squeeze idea on Philip Morris (PM). I just closed a squeeze in the Trade Desk, and while hunting for the next one, PM stood out on the daily. In this walkthrough I go through the three reasons it caught my eye: the squeeze itself, the upcoming earnings, and the trend. We start on the Squeeze Board with 65 active squeezes, filter to the multi-timeframe list, and see why PM's daily signal has backtested better than the 130-minute. Then we pull up the pre-earnings tendency into the July 22 report, and finish on the trend: the market pulse turning green, the pullback, the levels, and where a break could carry toward the $198.82 extension. Here are all the links mentioned in today's video: ➜ Volatility Box: https://www.volatilitybox.com ➜ Squeeze Setups: https://www.squeezesetups.com ----------------------------------------------------------- ⏱️ Chapters: 0:00 - Introduction 0:42 Reason 1: The squeeze, on the Squeeze Board 1:07 Multi-timeframe squeezes 1:35 Daily vs the 130-minute (backtest) 2:40 Reason 2: Earnings 3:20 The 10-year pre-earnings tendency 4:07 Reason 3: Trend and the market pulse 4:33 Levels, stop, and the target 5:08 Wrapping up ----------------------------------------------------------- ✅ Squeeze Setups Scanner: https://squeezesetups.com/pricing/ ✅ Squeeze Backtester: https://squeezesetups.com/backtester/ #daytrading #volatility #stockmarket
Browse by Category
Trade Ideas & Setups
221 videos
Market Analysis
93 videos
SPY / SPX
124 videos
QQQ / Nasdaq
63 videos
Futures Trading
130 videos
Earnings Plays
58 videos
Sector Analysis
31 videos
Individual Stock Analysis
83 videos
Volatility Trading
194 videos
Volatility Box
184 videos
TTM Squeeze
86 videos
Day Trading
82 videos
Swing Trading
18 videos
Options Trading
54 videos
Technical Indicators
52 videos
Fibonacci
20 videos
Chart Patterns
26 videos
Trend Analysis
43 videos
FOMC & Fed
21 videos
ThinkOrSwim Platform
63 videos
ThinkScript Coding
22 videos
Scanners
31 videos
Backtesting
29 videos
Opening Range Breakout (ORB)
40 videos
Commodities
46 videos
All Trade Reports
New Squeeze Feature and Philip Morris (PM) Trade Update
The squeeze has fired on 4/5 time frames inside of Philip Morris, but the behemoth squeezes still remain. I'll share an update on the trade, and congrats to those who took profits. We also released a new feature for the Squeeze Setups platform, making it easier to see support and resistance zones to catch pullbacks like the one in PM with more confidence. Here are all the links mentioned in today's video: ➜ Volatility Box: https://www.volatilitybox.com ➜ Squeeze Setups: https://www.squeezesetups.com ----------------------------------------------------------- ⏱️ Chapters: 0:00 - PM Update 0:45 - Fibonacci Symmetry 1:05 - New Feature 2:05 - Looking for New Trades 2:45 - Summary ----------------------------------------------------------- ✅ Squeeze Setups Scanner: https://squeezesetups.com/pricing/ ✅ Squeeze Backtester: https://squeezesetups.com/backtester/ #daytrading #volatility #stockmarket
How Many Squeeze Dots Is Enough? I Tested 822,381 Trades
How many squeeze dots should you wait for before you take the trade? I ran every squeeze across 615 stocks and 22 years of data, and simulated entering at every dot depth, dot 1, dot 2, dot 3, all the way to 20. That is over 800,000 entries. On its own the dot count looks like pure noise, the win rate barely moves. But split it by one thing you already have on your chart, whether the moving averages are stacked, and the answer completely flips. Here are all the links mentioned in today's video: ➜ Squeeze Backtester https://www.squeezesetups.com ----------------------------------------------------------- ⏱️ Here are video timestamps that might come in handy: 0:00 The unanswered question 1:25 The coiled-spring belief 2:21 How I tested it 4:02 The data set 4:32 Dots look like noise 5:18 Split by the trend 6:23 One signal, not two 7:18 Edge, not a hedge 8:41 What to actually do 9:54 The one takeaway ----------------------------------------------------------- ✅ Squeeze Setups Scanner: https://squeezesetups.com/pricing/ ✅ Squeeze Backtester: https://squeezesetups.com/backtester/ #daytrading #tradingstrategy #stockmarket #backtesting
Philip Morris (PM): 3 Reasons This Squeeze Is On My Radar
A new squeeze idea on Philip Morris (PM). I just closed a squeeze in the Trade Desk, and while hunting for the next one, PM stood out on the daily. In this walkthrough I go through the three reasons it caught my eye: the squeeze itself, the upcoming earnings, and the trend. We start on the Squeeze Board with 65 active squeezes, filter to the multi-timeframe list, and see why PM's daily signal has backtested better than the 130-minute. Then we pull up the pre-earnings tendency into the July 22 report, and finish on the trend: the market pulse turning green, the pullback, the levels, and where a break could carry toward the $198.82 extension. Here are all the links mentioned in today's video: ➜ Volatility Box: https://www.volatilitybox.com ➜ Squeeze Setups: https://www.squeezesetups.com ----------------------------------------------------------- ⏱️ Chapters: 0:00 - Introduction 0:42 Reason 1: The squeeze, on the Squeeze Board 1:07 Multi-timeframe squeezes 1:35 Daily vs the 130-minute (backtest) 2:40 Reason 2: Earnings 3:20 The 10-year pre-earnings tendency 4:07 Reason 3: Trend and the market pulse 4:33 Levels, stop, and the target 5:08 Wrapping up ----------------------------------------------------------- ✅ Squeeze Setups Scanner: https://squeezesetups.com/pricing/ ✅ Squeeze Backtester: https://squeezesetups.com/backtester/ #daytrading #volatility #stockmarket
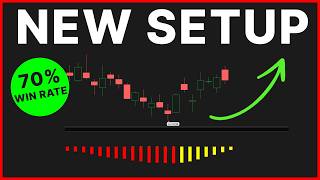
This 39-Minute Squeeze Has a 70% Win Rate
Here are 3 different trade setups, including one which has a 39-minute Slingshot Squeeze that has yet to fire. Here are all the links mentioned in today's video: ➜ Volatility Box: https://www.volatilitybox.com ➜ Squeeze Setups: https://www.squeezesetups.com ----------------------------------------------------------- ⏱️ Chapters: 0:00 - Introduction 0:25 - Example 1 (LOW) 1:11 - Example 2 (CAT) 2:00 - Example 3 (TTD) 4:20 - Summary ----------------------------------------------------------- ✅ Squeeze Setups Scanner: https://squeezesetups.com/pricing/ ✅ Squeeze Backtester: https://squeezesetups.com/backtester/ #daytrading #volatility #stockmarket
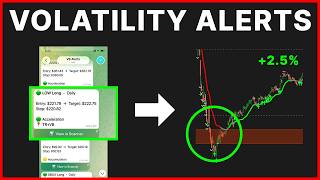
How to Pick and Choose the Best Volatility Alerts
We launched the Alerts feature for the Volatility Box platform! In this video, I will show you how to read the alerts, and pick and choose the best ones. Here are all the links mentioned in today's video: ➜ Volatility Box: https://www.volatilitybox.com ----------------------------------------------------------- ⏱️ Chapters: 0:00 - Introduction 0:23 - Example 1: MA 1:43 - Example 2: LOW 2:42 - Example 3: HON 3:55 - Summary ----------------------------------------------------------- ✅ Squeeze Setups Scanner: https://squeezesetups.com/pricing/ ✅ Squeeze Backtester: https://squeezesetups.com/backtester/ #daytrading #volatility #stockmarket
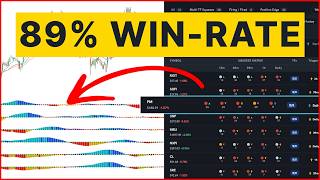
This Squeeze Has a 89% Win Rate Over 20 Years
Let's take a look at a Squeeze Signals setup that is still active and has a 89% win rate over the past 20 years. Additionally, there are multiple time frames squeezing: 15-min, 30-min, 39-min, 78-min, 195-min, 2-hr, Daily, and Weekly! Here are all the links mentioned in the video: ➜ Squeeze Setups (Free for Bundle Members): https://squeezesetups.com ➜ Bundle Discount https://tosindicators.com/pricing/ ----------------------------------------------------------- ⏱️ Here are video timestamps that might come in handy: 0:00 - Introduction 0:18 - Squeeze Scanner 1:20 - Trade Entry 2:29 - Example in XLK 3:35 - Volatility Box Bundle ----------------------------------------------------------- ✅ Download the Futures Volatility Box here: https://www.tosindicators.com/volatility-box ✅ Download the Stock Volatility Box here: https://www.volatilitybox.com/product/volatility-box-stock-early-invite/ ✅ Watch the new Triple Pro Squeeze course here: https://www.tosindicators.com/squeeze-course #DayTrading #SwingTrading #stockmarket
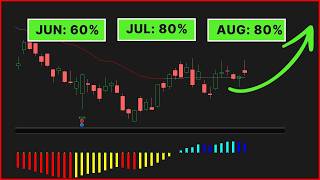
This Stock GOES UP in July 80% of the Time
This S&P 100 stock has a history of outperforming in July, when you look back more than 20 years. I'll share the setup, and the exact entry I am using. Here are all the links mentioned in today's video: ➜ Market Pulse (Free): https://tosindicators.com/indicators/market-pulse ➜ Seasonal Analysis (Free): https://tosindicators.com/indicators/seasonal-analysis ----------------------------------------------------------- ⏱️ Chapters: 0:00 - Trade Plan PDF 0:38 - Setup Overview 0:50 - Trend Reversal 1:23 - Seasonal Analysis 1:55 - Volatility 2:20 - Trade Management ----------------------------------------------------------- ✅ Squeeze Setups Scanner: https://squeezesetups.com/pricing/ ✅ Squeeze Backtester: https://squeezesetups.com/backtester/ #daytrading #tradingstrategy #stockmarket #backtesting #trading
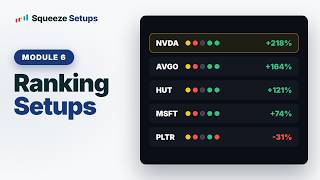
Rank Different Squeeze Setups - How to Trade Squeezes (Part 6)
In about 5 minutes I'll show you how to rank every Squeeze Setup on the board, so you can automatically focus your attention on the best setups. This is Part 6 of How to Trade Squeezes, where the framework becomes a ranking you can act on. What You'll Learn: - Why trend is the gate every setup has to clear first - The three things the drawer reads to score a setup - Confluence across timeframes, and the confluence trap to avoid - Stack age and extension: the two factors that sharpen which setup to pick ➡️ Find the best squeezes on the Squeeze Setups platform: https://www.squeezesetups.com ----------------------------------------------------------- ⏱️ Video timestamps: 0:00 - The Platform Sorts It For You 0:25 - The Gate: Trend 1:15 - The Edge 1:45 - Confluence (and the Trap) 2:47 - Stack Age and Extension 4:56 - The Board Does This For You ----------------------------------------------------------- ✅ Download the Futures Volatility Box here: https://www.tosindicators.com/volatility-box ✅ Download the Stock Volatility Box here: https://www.volatilitybox.com ✅ Find the Best Squeezes here: https://www.squeezesetups.com #Volatility #SwingTrading #DayTrading
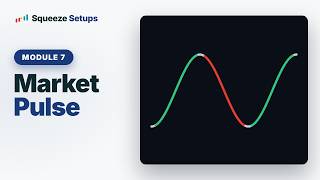
Squeezes Across Different Market Stages - How to Trade Squeezes (Part 7)
The Market Pulse is your regime read, and clearly tells you which of four stages the market is in. In this video, we will link those market stages to the squeeze. You'll learn which market stages the squeeze works well in, along with which market stages to AVOID! This is Part 7 of How to Trade Squeezes, the context that tells you when to lean in and when to step aside. What You'll Learn: - How Market Pulse reads the regime with a single moving line - The four market stages: Acceleration, Accumulation, Distribution, and Deceleration - How to use the stage to size up or stand down - The one rule that keeps you trading with the trend, not against it ➡️ Find the best squeezes on the Squeeze Setups platform: https://www.squeezesetups.com ----------------------------------------------------------- ⏱️ Video timestamps: 0:00 - The Regime Read 0:35 - The Four Stages 2:33 - How to Use It 2:48 - The One Rule ----------------------------------------------------------- ✅ Download the Futures Volatility Box here: https://www.tosindicators.com/volatility-box ✅ Download the Stock Volatility Box here: https://www.volatilitybox.com ✅ Find the Best Squeezes here: https://www.squeezesetups.com #Volatility #SwingTrading #DayTrading
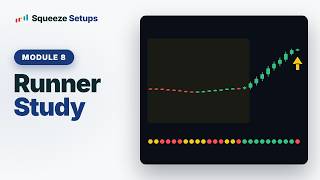
The Runner Study - How to Trade Squeezes (Part 8)
To wait or not to wait? We pulled the data on pullbacks across our sample, and the answer surprised a lot of traders. In about 3 minutes you'll see what waiting for a better entry actually costs you. This is Part 8 of How to Trade Squeezes, a data study that settles a question every squeeze trader asks. What You'll Learn: - Where the runner data comes from and how we measured it - The number that jumped out when we compared waiting versus entering - Why the same pattern holds on both the long and short side - What to do about it, and where adding to a position actually makes sense ➡️ Find the best squeezes on the Squeeze Setups platform: https://www.squeezesetups.com ----------------------------------------------------------- ⏱️ Video timestamps: 0:00 - The Short Version 0:29 - Where the Data Comes From 0:59 - The Number That Jumped Out 1:50 - Waiting Skips Your Best 2:12 - What to Do About It ----------------------------------------------------------- ✅ Download the Futures Volatility Box here: https://www.tosindicators.com/volatility-box ✅ Download the Stock Volatility Box here: https://www.volatilitybox.com ✅ Find the Best Squeezes here: https://www.squeezesetups.com #Volatility #SwingTrading #DayTrading
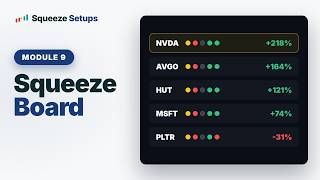
Squeeze Board - How to Trade Squeezes (Part 9)
The Squeeze Board is the home base of the platform, and this is where you'll spend most of your time. I'll walk you through the tabs, the multi-timeframe matrix, and how to read a single row end to end. This is Part 9 of How to Trade Squeezes, and it kicks off Part 2 of the series: a full tour of the Squeeze Setups platform. What You'll Learn: - The board tabs, including the Multi-Timeframe Squeeze and Positive Edge filters - How to set the exact timeframes you want to watch - Reading a row across the matrix, trigger, status, and backtest columns - Using the filters to cut hundreds of names down to a short list ✅ Find the best squeezes on the Squeeze Setups platform: https://www.squeezesetups.com ----------------------------------------------------------- ⏱️ Video timestamps: 0:00 - Welcome 0:40 - The Tabs 1:19 - Positive Edge 1:56 - Set Your Timeframes 3:26 - The Filters 4:08 - Reading a Row 5:52 - The Backtest Block 8:25 - The Status Column ----------------------------------------------------------- ✅ Download the Futures Volatility Box here: https://www.tosindicators.com/volatility-box ✅ Download the Stock Volatility Box here: https://www.volatilitybox.com ✅ Find the Best Squeezes here: https://www.squeezesetups.com #Volatility #SwingTrading #DayTrading
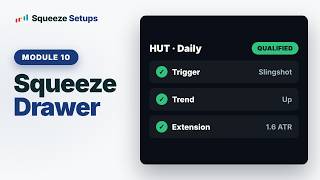
Reading the Squeeze Drawer - How to Trade Squeezes (Part 10)
Click any row on the board and the drawer slides open with everything you need to make a decision. You will be able to see a) clear yes or no signal, b) the three filters, c) the performance numbers, and d) the full trade list. This is Part 10 of How to Trade Squeezes, our complete series on finding and trading the squeeze. What You'll Learn: - How to read the drawer's verdict at a glance - The three filters every setup has to clear - What it means when a setup only meets two of the three - Performance at a glance, the numbers, and every historical trade ✅ Find the best squeezes on the Squeeze Setups platform: https://www.squeezesetups.com ----------------------------------------------------------- ⏱️ Video timestamps: 0:00 - Welcome 0:30 - The Verdict 0:50 - The Three Filters 1:30 - When a Setup Fails 2:46 - Performance at a Glance 3:46 - Every Trade, Listed 4:27 - Open in Backtester 4:56 - Open in Charts ----------------------------------------------------------- ✅ Download the Futures Volatility Box here: https://www.tosindicators.com/volatility-box ✅ Download the Stock Volatility Box here: https://www.volatilitybox.com ✅ Find the Best Squeezes here: https://www.squeezesetups.com #Volatility #SwingTrading #DayTrading
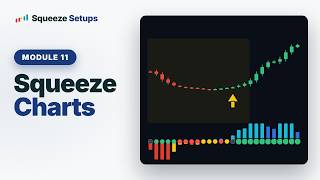
Squeeze Charts - How to Trade Squeezes (Part 11)
We built charts optimized specifically for the squeeze. S Squeeze Charts is built for speed: jump to any name, flip across timeframes, and read the squeeze on a clean, fast chart. I'll show you how to move through it without slowing down. This is Part 11 of How to Trade Squeezes, our complete series on finding and trading the squeeze. What You'll Learn: - How the Charts page is built for fast multi-timeframe reads - Jumping to any chart from the board or the drawer - Switching timeframes fast with the quick switch list - Trend filters and choosing exactly which squeezes you want to see ✅ Find the best squeezes on the Squeeze Setups platform: https://www.squeezesetups.com ----------------------------------------------------------- ⏱️ Video timestamps: 0:00 - Welcome 0:24 - Built for Speed 0:50 - Multi-Timeframe View 1:38 - Any Timeframe, Any Chart 2:48 - Switch Timeframes Fast 3:55 - Trend Filters 4:26 - Choose Your Squeezes 5:22 - Read Across Timeframes ----------------------------------------------------------- ✅ Download the Futures Volatility Box here: https://www.tosindicators.com/volatility-box ✅ Download the Stock Volatility Box here: https://www.volatilitybox.com ✅ Find the Best Squeezes here: https://www.squeezesetups.com #Volatility #SwingTrading #DayTrading
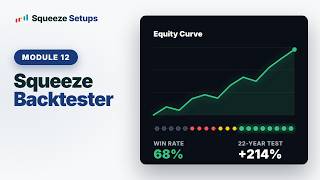
Squeeze Backtester - How to Trade Squeezes (Part 12)
The Squeeze Backtester is where you pressure-test a setup before you risk a dollar. I'll walk you through picking the timeframe and trigger, reading the stats and the equity curve, and spotting a strategy that isn't worth trading. This is Part 12 of How to Trade Squeezes, our complete series on finding and trading the squeeze. What You'll Learn: - How to pick the timeframe and trigger to test - Reading the stats and the equity curve - How to spot a bad strategy quickly - The three filters and testing both triggers ✅ Find the best squeezes on the Squeeze Setups platform: https://www.squeezesetups.com ----------------------------------------------------------- ⏱️ Video timestamps: 0:00 - Welcome 0:40 - Pick the Timeframe and Trigger 1:15 - The Stats 1:29 - The Equity Curve 1:52 - Spot a Bad Strategy 2:21 - Every Trade, Listed 2:54 - The Three Filters ----------------------------------------------------------- ✅ Download the Futures Volatility Box here: https://www.tosindicators.com/volatility-box ✅ Download the Stock Volatility Box here: https://www.volatilitybox.com ✅ Find the Best Squeezes here: https://www.squeezesetups.com #Volatility #SwingTrading #DayTrading
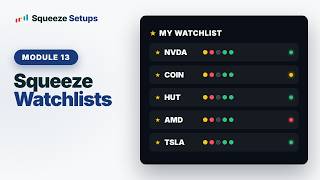
Squeeze Watchlists - How to Trade Squeezes (Part 13)
Watchlists keep the platform focused on the names you actually care about. I'll show you how to build one, add your symbols, and read the squeeze across your timeframes, then set an alert so the setups come to you. This is Part 13 of How to Trade Squeezes, our complete series on finding and trading the squeeze. What You'll Learn: - How to create a watchlist and add your symbols - Reading squeezes across your chosen timeframes - Checking trend and momentum on your list - Setting an alert straight from the watchlist ✅ Find the best squeezes on the Squeeze Setups platform: https://www.squeezesetups.com ----------------------------------------------------------- ⏱️ Video timestamps: 0:00 - Welcome 0:43 - Create a Watchlist 0:56 - Add Your Symbols 1:29 - Squeezes on Your Timeframes 1:49 - Trend and Momentum 2:01 - Set an Alert ----------------------------------------------------------- ✅ Download the Futures Volatility Box here: https://www.tosindicators.com/volatility-box ✅ Download the Stock Volatility Box here: https://www.volatilitybox.com ✅ Find the Best Squeezes here: https://www.squeezesetups.com #Volatility #SwingTrading #DayTrading
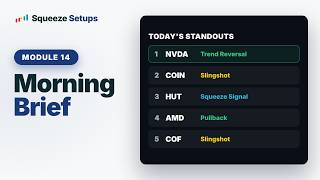
Morning Brief - How to Trade Squeezes (Part 14)
The Morning Brief gives you the day's ranked standouts before the bell, so you start with context instead of a blank screen. I'll show you how to read it, filter it to your style, and walk a real example. This is Part 14 of How to Trade Squeezes, our complete series on finding and trading the squeeze. What You'll Learn: - How the brief surfaces today's setups before the open - Reading the signal column and the three setups - Filtering the brief to your own trading style - A real example, and how the brief feeds the board ✅ Find the best squeezes on the Squeeze Setups platform: https://www.squeezesetups.com ----------------------------------------------------------- ⏱️ Video timestamps: 0:00 - Welcome 0:38 - Today's Setups 1:14 - The Signal Column 1:56 - Three Setups 2:15 - Filter by Your Style 2:50 - An Example: COF 3:41 - Brief vs Board 4:38 - The Takeaway ----------------------------------------------------------- ✅ Download the Futures Volatility Box here: https://www.tosindicators.com/volatility-box ✅ Download the Stock Volatility Box here: https://www.volatilitybox.com ✅ Find the Best Squeezes here: https://www.squeezesetups.com #Volatility #SwingTrading #DayTrading
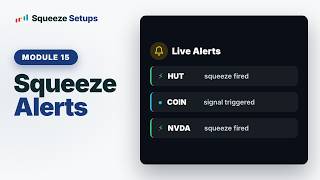
Squeeze Alerts - How to Trade Squeezes (Part 15)
Squeeze Alerts make sure you never miss a squeeze, on screen or on your phone. I'll show you both ways to get alerted, how to connect Telegram, and how to filter the noise down to only what matters. This is Part 15 of How to Trade Squeezes, our complete series on finding and trading the squeeze. What You'll Learn: - The two ways to get alerts, in-platform and on mobile - Connecting your account to Telegram - Alert rules: triggers, timeframe stacks, fires - Filtering to a positive backtest and your own symbols, plus quiet hours ✅ Find the best squeezes on the Squeeze Setups platform: https://www.squeezesetups.com ----------------------------------------------------------- ⏱️ Video timestamps: 0:00 - Welcome 0:26 - Two Ways to Get Alerts 1:16 - Telegram on Mobile 1:45 - Connect Your Account 2:30 - Alert Rules 3:19 - Filter What Matters 3:48 - Quiet Hours 4:08 - Trade the Moves ----------------------------------------------------------- ✅ Download the Futures Volatility Box here: https://www.tosindicators.com/volatility-box ✅ Download the Stock Volatility Box here: https://www.volatilitybox.com ✅ Find the Best Squeezes here: https://www.squeezesetups.com #Volatility #SwingTrading #DayTrading
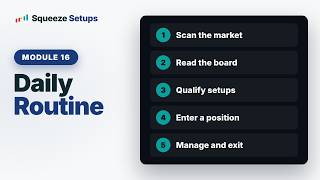
Daily Routine - How to Trade Squeezes (Part 16)
This kicks off Part 3 of the series: turning everything you've learned into a repeatable habit. I'll walk you through the five simple steps you can run every single day, from scanning the market to managing the trade. This is Part 16 of How to Trade Squeezes, our complete series on finding and trading the squeeze. What You'll Learn: - Step 1: Scan the market with the Morning Brief - Step 2: Read the board for confluence across timeframes - Step 3: Qualify the setup against a simple checklist - Steps 4 and 5: Enter a starter, then manage and exit with patience ✅ Find the best squeezes on the Squeeze Setups platform: https://www.squeezesetups.com ----------------------------------------------------------- ⏱️ Video timestamps: 0:00 - Welcome 0:35 - Step 1: Scan the Market 1:10 - Step 2: Read the Board 1:48 - Step 3: Qualify the Setup 3:25 - Step 4: Enter a Position 4:04 - Step 5: Manage and Exit 4:52 - Recap ----------------------------------------------------------- ✅ Download the Futures Volatility Box here: https://www.tosindicators.com/volatility-box ✅ Download the Stock Volatility Box here: https://www.volatilitybox.com ✅ Find the Best Squeezes here: https://www.squeezesetups.com #Volatility #SwingTrading #DayTrading
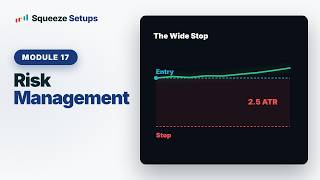
Risk Management - How to Trade Squeezes (Part 17)
Risk management is what keeps you in the game. I'll show you the two downloads that help you stay disciplined, the trade plan and the trade journal, then walk through three simple risk rules that protect your account. This is Part 17 of How to Trade Squeezes, our complete series on finding and trading the squeeze. What You'll Learn: - Where to find the trade plan PDF and the trade journal spreadsheet - Rule 1: Decide your risk before you enter, not after - Rule 2: Size the position from that risk (shares = risk divided by stop distance) - Rule 3: Set a wide stop and let the squeeze do its thing ✅ Find the best squeezes on the Squeeze Setups platform: https://www.squeezesetups.com ----------------------------------------------------------- ⏱️ Video timestamps: 0:00 - Welcome 0:21 - Your Downloads 0:35 - The Trade Plan PDF 0:51 - The Trade Journal 1:09 - Rule 1: Decide Risk First 1:28 - Rule 2: Size From the Risk 2:06 - Rule 3: Wide Stop 2:49 - Journal Every Trade 3:31 - Bringing It Together ----------------------------------------------------------- ✅ Download the Futures Volatility Box here: https://www.tosindicators.com/volatility-box ✅ Download the Stock Volatility Box here: https://www.volatilitybox.com ✅ Find the Best Squeezes here: https://www.squeezesetups.com #Volatility #SwingTrading #DayTrading
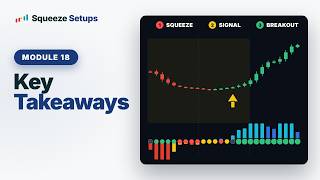
Key Takeaways - How to Trade Squeezes (Part 18)
The final video brings the whole series together. I'll recap what a squeeze actually is, the two setups we trade, why confirmation gives you an edge, and the daily tools that tie it all into one process. This is Part 18 of How to Trade Squeezes, the final video in our complete series on finding and trading the squeeze. Thanks for watching, and if you have questions we're here to help at co*****@***********ps.com. What You'll Learn: - What a squeeze is, and what it does and doesn't tell you - The two setups: the Slingshot Squeeze and the Squeeze Signal - Why trend, confluence, and a positive backtest turn a signal into an edge - The daily tools: brief, board, backtester, watchlists, and alerts ✅ Find the best squeezes on the Squeeze Setups platform: https://www.squeezesetups.com ----------------------------------------------------------- ⏱️ Video timestamps: 0:00 - Welcome 0:09 - What Is a Squeeze 0:34 - The Two Setups 0:53 - The Backtest 1:14 - The Non-Negotiables 1:40 - The Daily Tools 1:57 - Watchlists and Alerts 2:07 - Share Feedback ----------------------------------------------------------- ✅ Download the Futures Volatility Box here: https://www.tosindicators.com/volatility-box ✅ Download the Stock Volatility Box here: https://www.volatilitybox.com ✅ Find the Best Squeezes here: https://www.squeezesetups.com #Volatility #SwingTrading #DayTrading
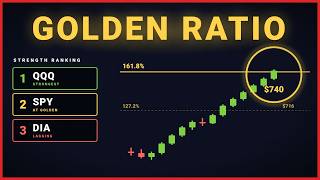
S&P 500 Hits the Golden Ratio (Here's What Comes Next)
The S&P 500 hit the Golden Ratio at $740.21. The strength that carried us in is fading, but buyers are still hanging around. In this video we zoom out on SPY, QQQ, and DIA, lay out the key Fibonacci levels, rank the three majors, then use that bias to read the intraday Volatility Box setups. QQQ is the strongest. SPY just tagged the Golden Ratio. DIA already made the 1.618 to 1.272 move back in March and April. ✅ Volatility Trading Platform: volatilitybox.com ✅ Opening Range Breakout Platform: orbsetups.com ⏱️ Timestamps: 0:00 Golden Ratio tagged 0:29 SPY key levels 3:17 QQQ and DIA 4:18 Ranking the majors 4:42 Intraday VB setups 7:25 Takeaways #spy #qqq #dia #fibonacci #goldenratio #daytrading #volatilitybox #thinkorswim
Phase Transitions— Physics of Trading 5/5 (Free Course)
In the final episode, I break down phase transitions in relation to physics. Markets do not move through one continuous state. They cycle through four discrete stages, and the transition between them is sharp, not gradual. Richard Wyckoff identified the cycle in the 1920s studying institutional accumulation and distribution. Stan Weinstein formalized stage analysis in 1988. Landau gave us the modern theory of phase transitions in 1937. The pattern is universal because the physics is universal. This wraps the five-part framework: motion, energy, oscillation, temperature, and phase. Thanks for watching! --- ⏱️ Timestamps: 0:00 - The trade that paid for six weeks and gapped overnight 1:38 - Why every market cycles through four stages 3:05 - Phases of matter and the flat-spot rule 4:30 - The four stages, named in order 7:03 - NVDA 2021 to 2023, one full cycle on a single chart 9:07 - TSLA 2024 to 2025, two cycles in eighteen months 9:56 - Why most strategies fail in two of four stages 11:05 - Market Pulse and the detection problem 12:06 - The complete five-lens framework --- ✅ Volatility Trading Platform: https://www.volatilitybox.com ✅ Opening Range Breakout Platform: https://www.orbsetups.com #marketanalysis #swingtrading #daytrading
Temperature — Physics of Trading 4/5 (Free Course)
In Episode 4, I break down volatility in relation to physics. Volatility in markets is mathematically the same statistic as temperature in physics, and the equation that prices nearly every option you trade is the heat equation in disguise. Bachelier wrote it down for stock prices in 1900. Einstein used it to prove atoms exist in 1905. Black-Scholes-Merton added the no-arbitrage argument in 1973 and won a Nobel. Episode 5 releasing soon. ✅ IV Percentile (rank implied vol against the trailing one-year range): https://tosindicators.com/indicators/iv-percentile ✅ Free ThinkOrSwim Indicators: https://tosindicators.com/indicators --- ⏱️ Timestamps: 0:00 - The trade you got right that lost you money 1:00 - Volatility is temperature (the statistic the chart hides) 3:20 - Why ATR sizing is the Kelly answer 5:15 - Black-Scholes IS the heat equation 8:30 - Same stock. Four times the premium. 9:45 - The earnings IV crush, decomposed 12:05 - IV Percentile and the variance risk premium 14:15 - Volatility clustering, reversion, and the VIX --- ✅ Volatility Trading Platform: https://www.volatilitybox.com ✅ Opening Range Breakout Platform: https://www.orbsetups.com #physicsoftrading #thinkorswim #blackscholes #ivpercentile #optionstrading
Oscillation — Physics of Trading 3/5 (Free Course)
In Episode 3, I break down oscillation as a physics concept and connect it directly to trading indicators like RSI and Bollinger Bands. We’ll cover pendulums, Hooke’s Law, equilibrium, amplitude, period, damping, and how those same principles appear in market structure and range behavior. I’ll also explain why fixed RSI thresholds fail when market regimes shift, and walk through real chart examples using XLP, Lowe’s, and YUM Brands. Episode 4 releasing soon. ✅ Dynamic RSI (adaptive bands, RSI-band squeeze, auto trendlines): https://tosindicators.com/indicators/dynamic-rsi ✅ Free ThinkOrSwim Indicators: https://tosindicators.com/indicators --- ⏱️ Timestamps: 0:00 - Introduction 1:00 - Recap of Ep 1 + Ep 2 1:27 - Pendulums, springs, Hooke’s Law 2:16 - The four properties of any oscillation 3:06 - A range, decoded 4:13 - Real examples (XLP, LOW, YUM) 5:31 - The RSI problem 6:16 - Dynamic RSI: adaptive bands and squeeze on the oscillator 7:47 - Damping and the bridge to compression 9:01 - Resonance and external rhythms 10:00 - The framework so far 10:43 - Close --- ✅ Volatility Trading Platform: https://www.volatilitybox.com ✅ Opening Range Breakout Platform: https://www.orbsetups.com #physicsoftrading #thinkorswim #dynamicrsi #rangetrading