
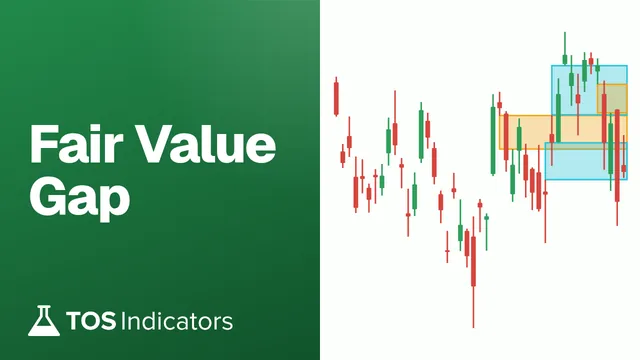
 Fair Value Gap
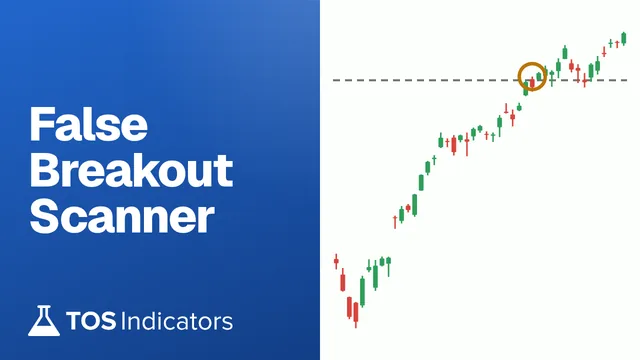 False Breakout Scanner
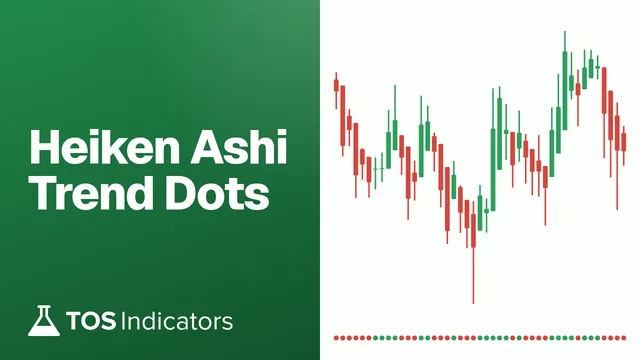 Heiken Ashi Trend
 Stock Volatility Box
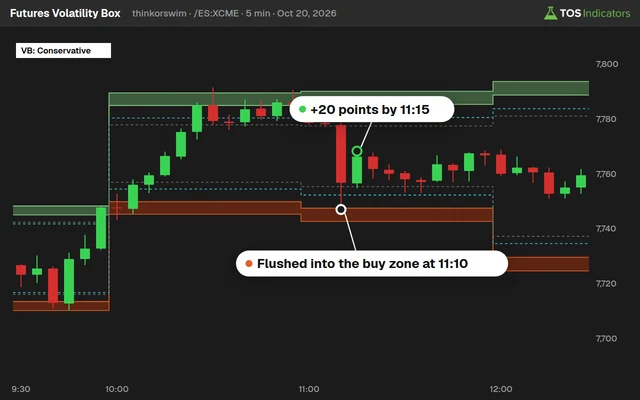 Futures Volatility Box
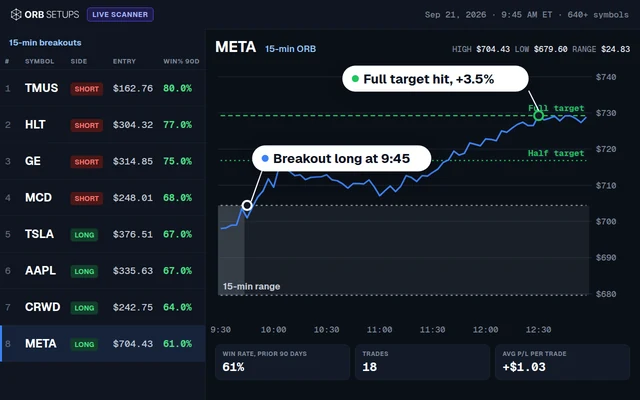 ORB Setups
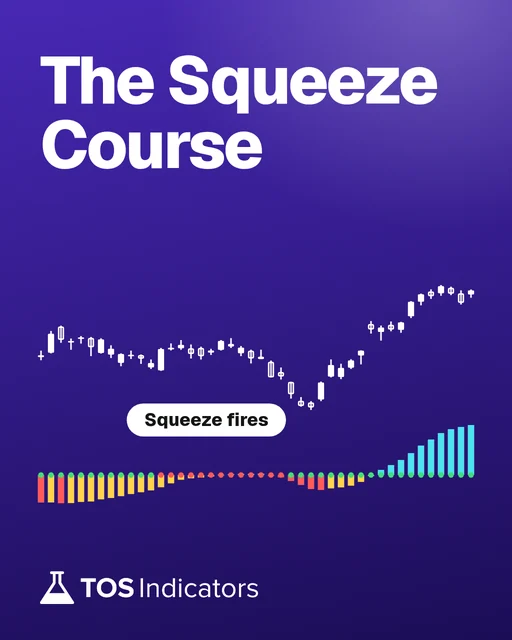
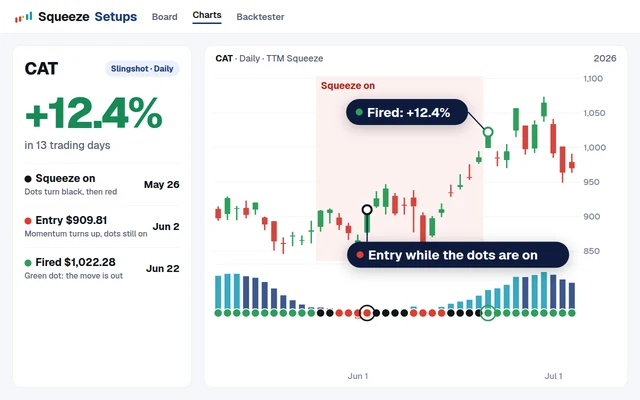 Squeeze Setups
ORB Setups
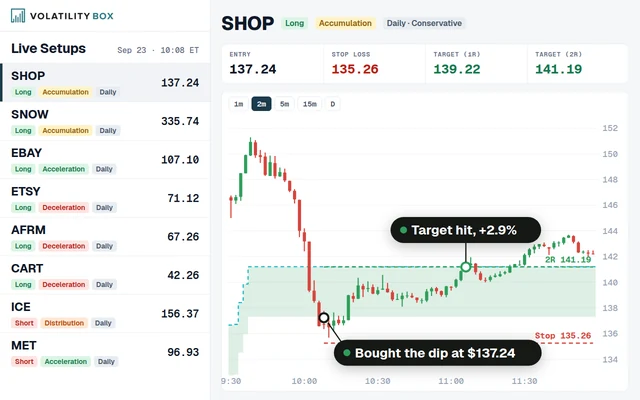
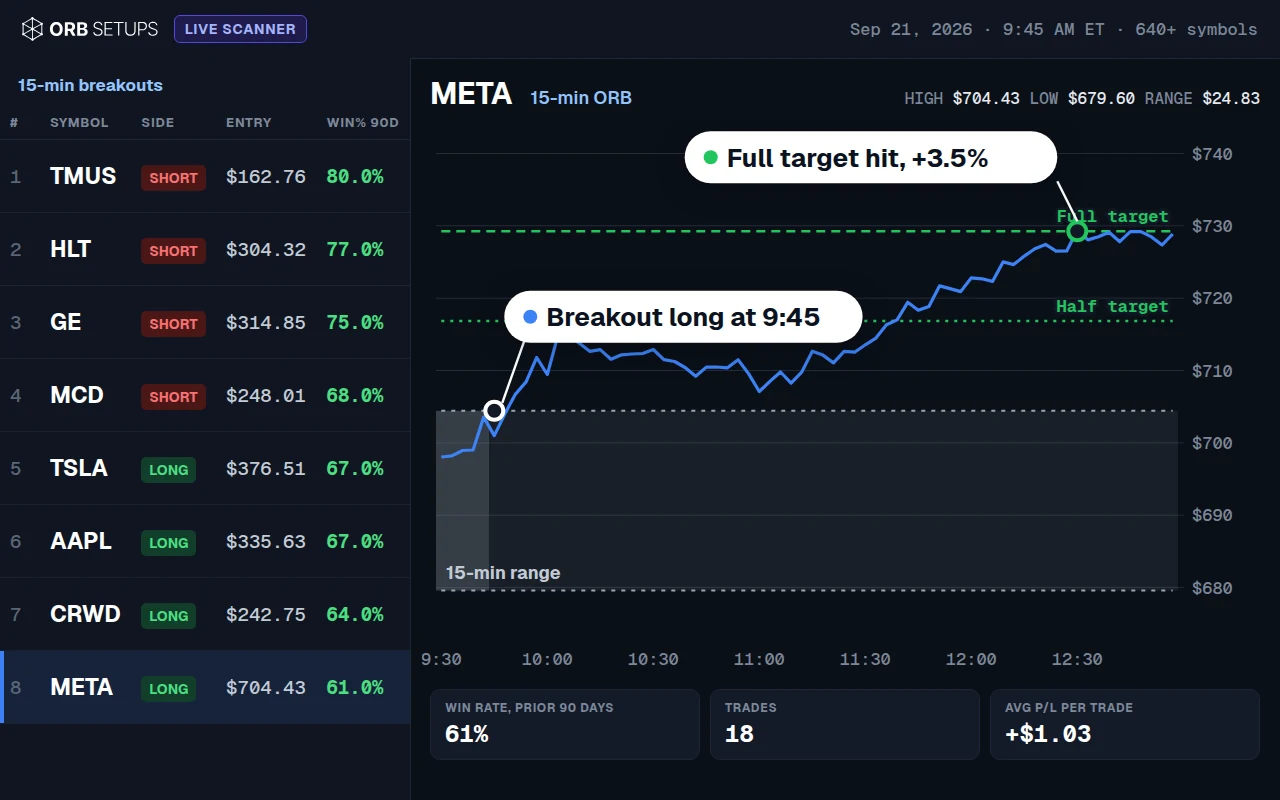
See each setup's win rate before you take it. ORB Setups scans 640+ stocks and ETFs for opening range breakouts every 2 minutes during market hours, and every setup shows its entry, stop, target and that symbol's 90-day win rate.
$99a month, cancel anytime
Is the breakout worth taking?
Over two years and 625,000+ backtested trades, the average opening range breakout won 52% of the time. Close to a coin flip. Every morning dozens of stocks break their opening range, but which ones actually have an edge? SPY or QQQ? AAPL or TSLA? The 5-minute breakout or the 15? You can't backtest fast enough to know, so most traders guess. ORB Setups shows each symbol's own record before you risk a dollar.
What you get
- A live scanner on 640+ stocks and ETFs
- Refreshed every 2 minutes in market hours
- 5, 15 and 30-minute opening ranges
- Breakout and pullback entries
- Entry, stop and target for every setup
- 90-day win rate and a conviction score
- A backtester on 2 years of 1-minute data
- Market Pulse and sectors before the open
One platform, three timeframes
Everything for the opening range in one place, from the pre-market read to the closed trade.
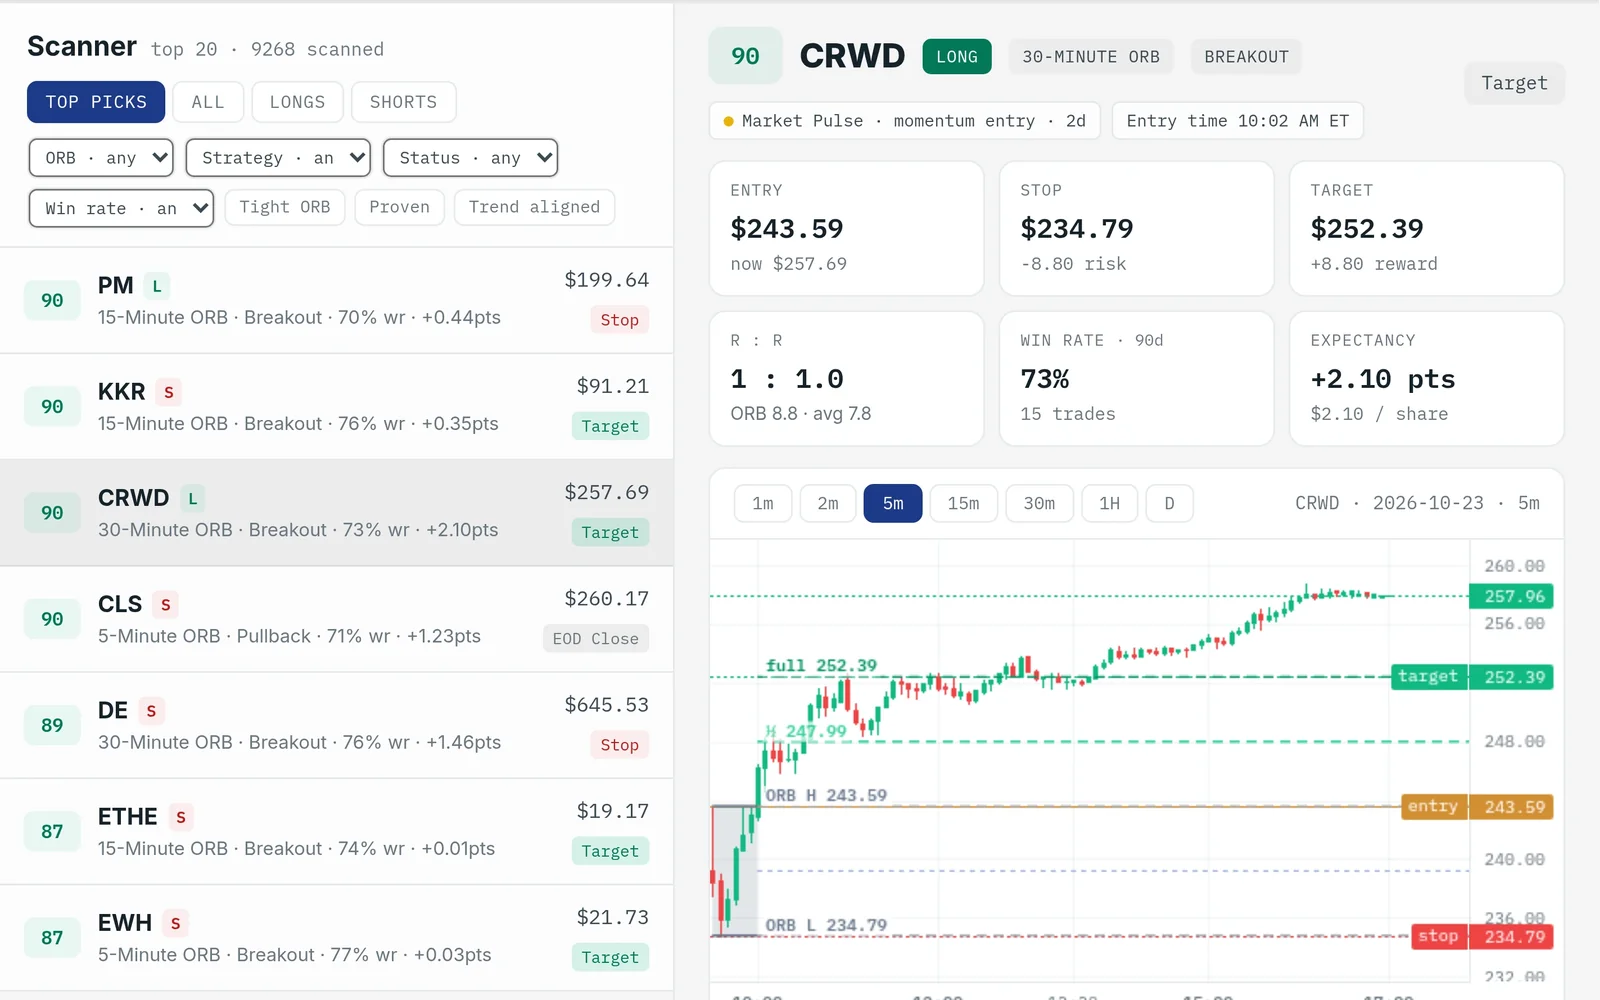
Live scanner
640+ symbols scanned every 2 minutes across the 5, 15 and 30-minute opening ranges, with entry, stop, target, win rate and conviction score.
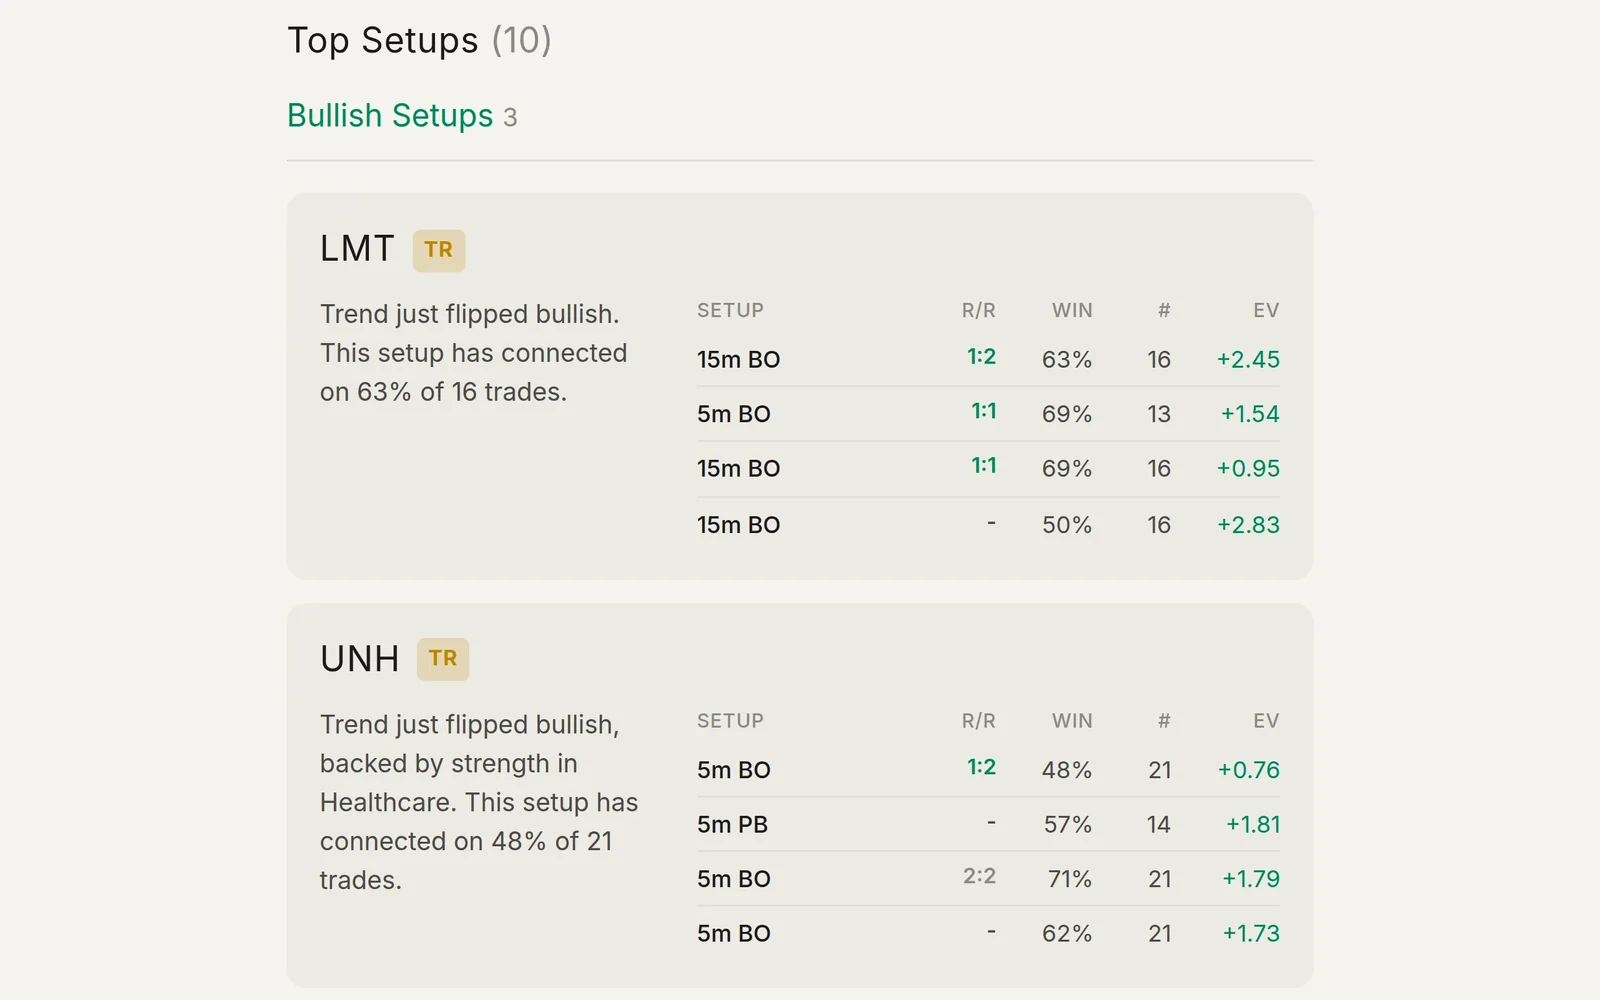
ORB strategies
Breakout and pullback entries, each with its historical win rate and expectancy.
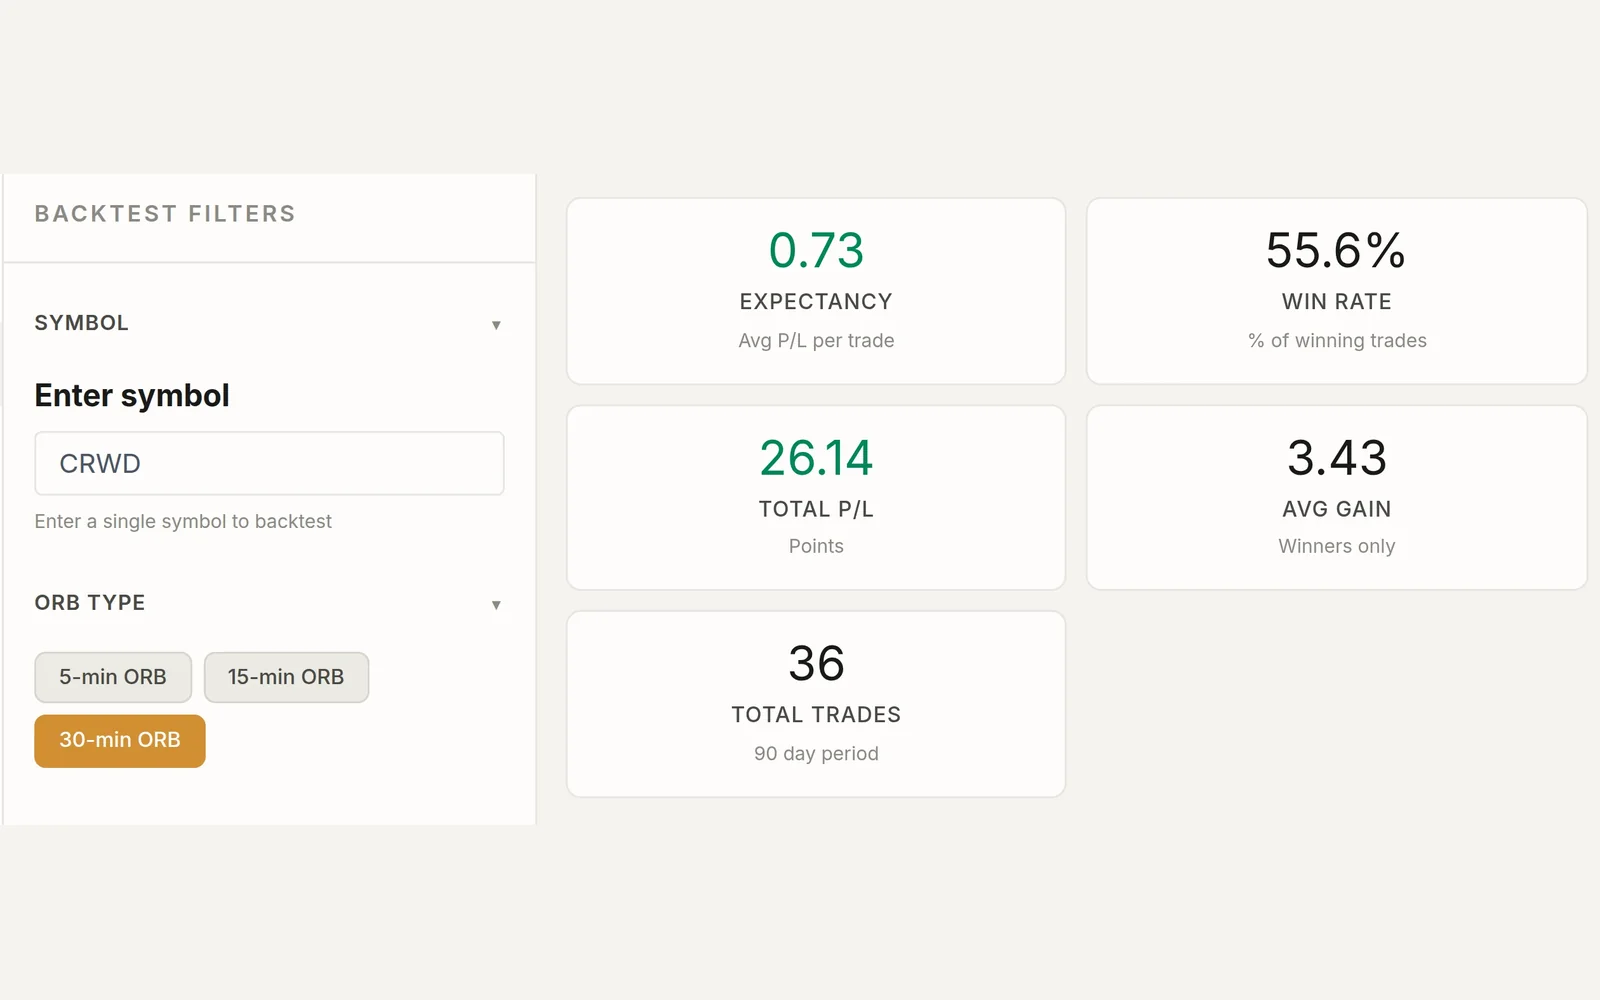
Backtester
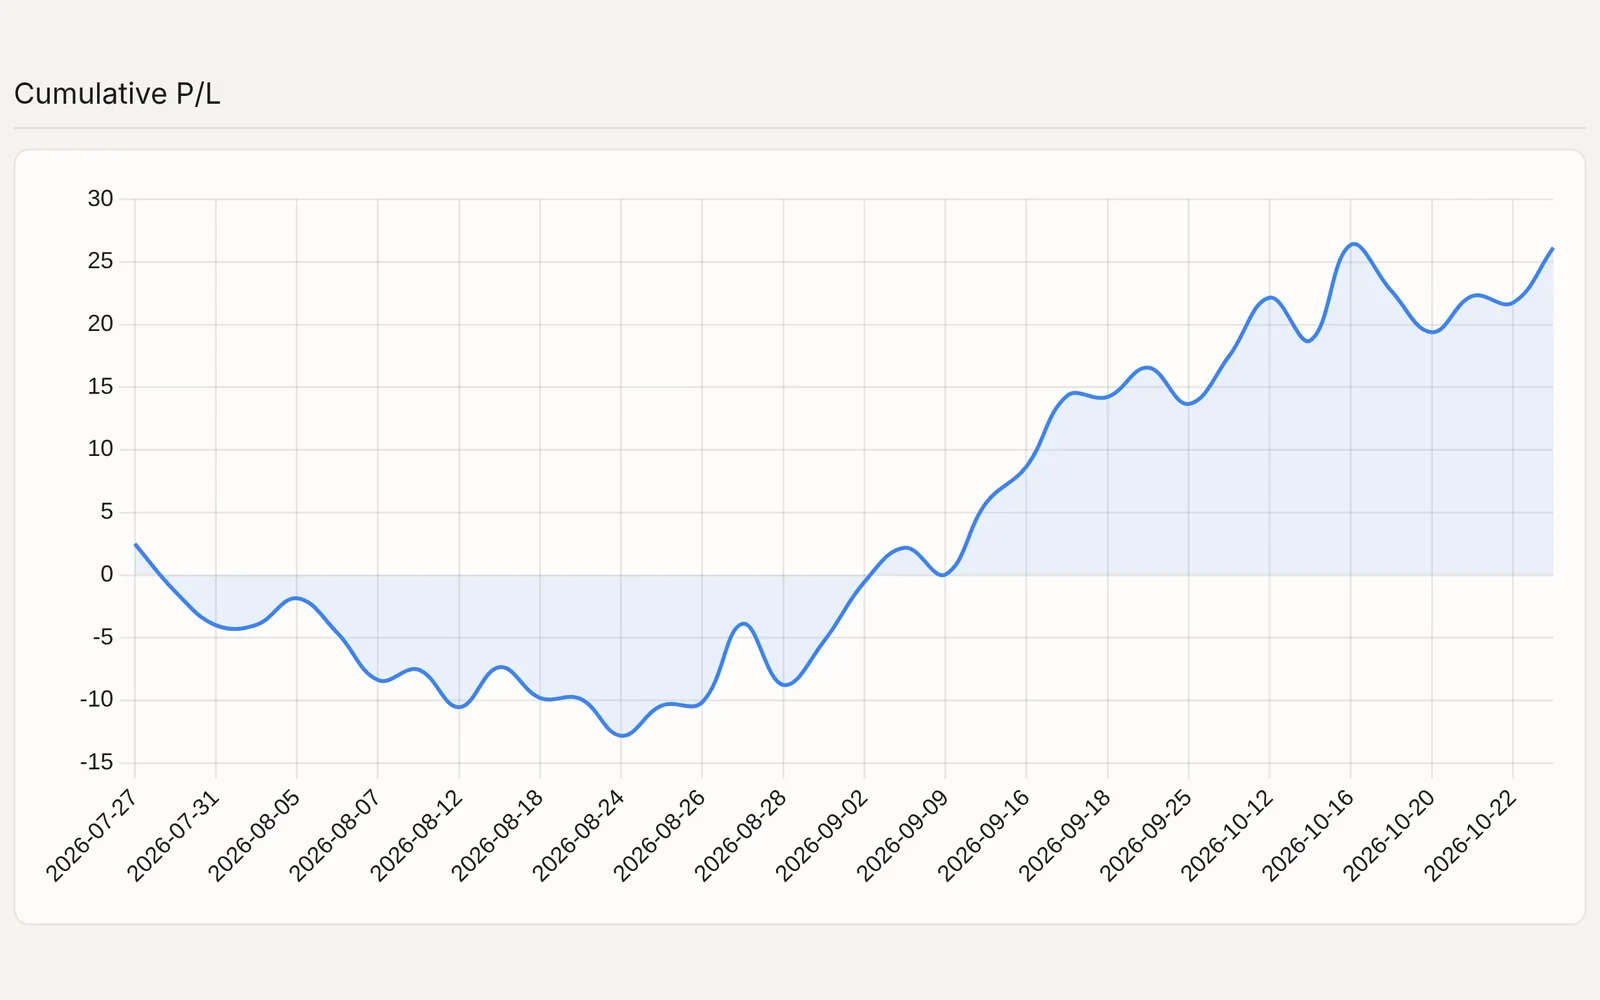
Query any symbol, timeframe or strategy and see win rate, expectancy and cumulative P/L in seconds.
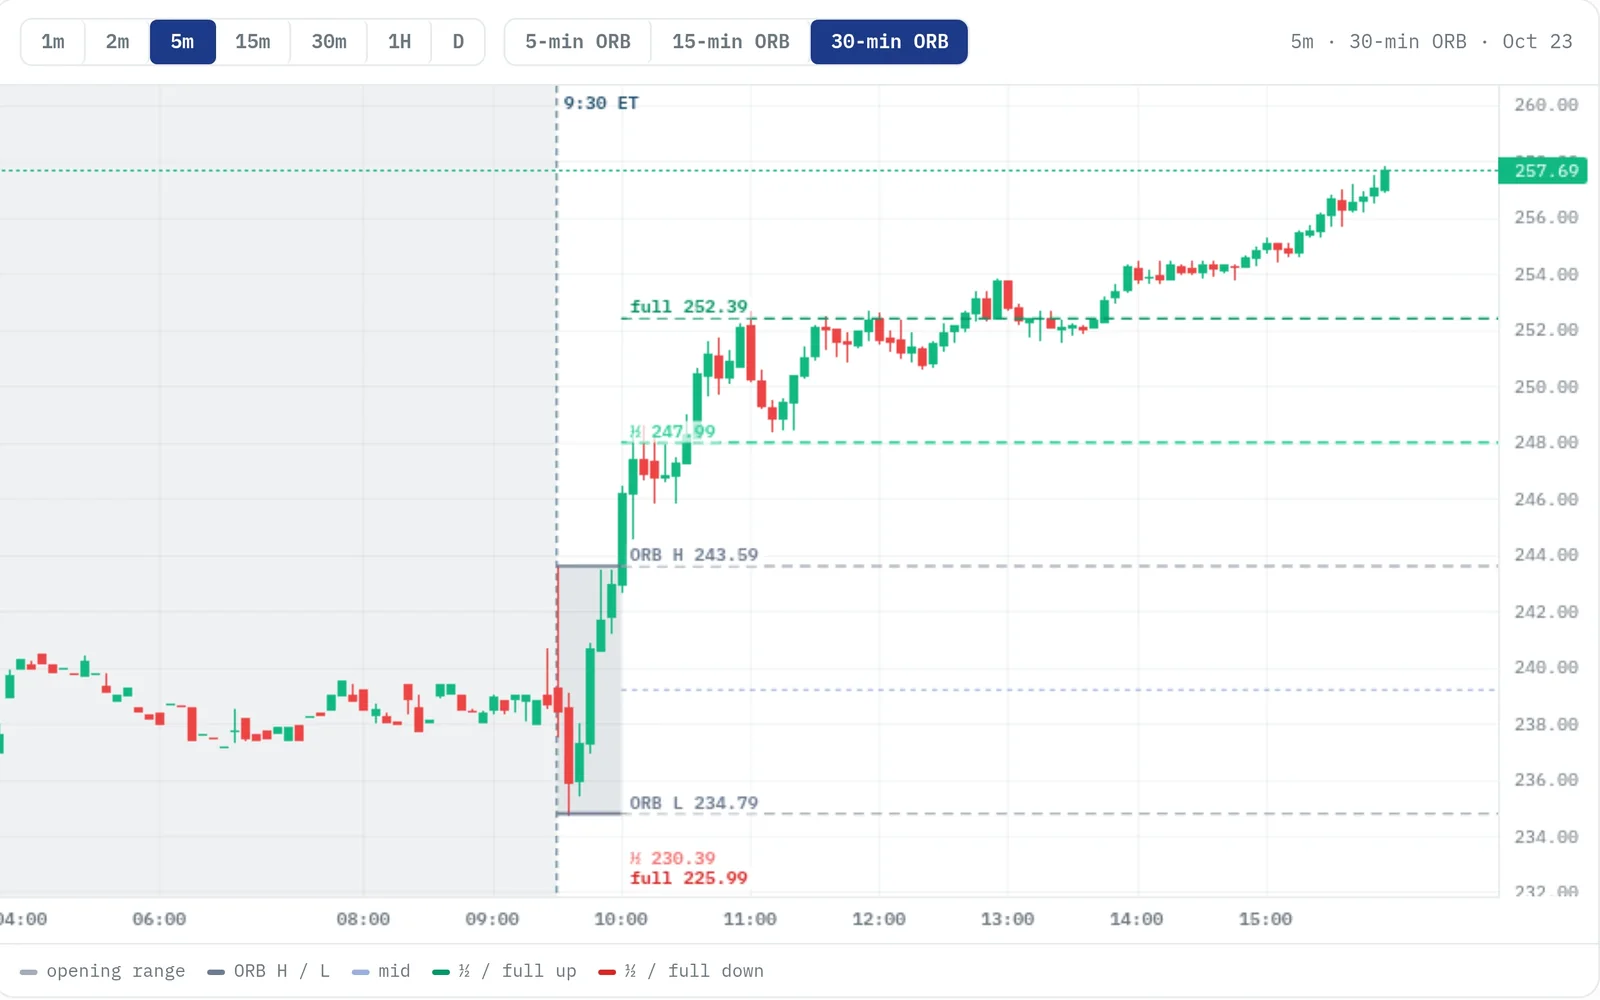
Symbol charts
Opening range high and low, half targets and full targets drawn on an interactive intraday chart, with the 5, 15 and 30-minute ranges one click apart.
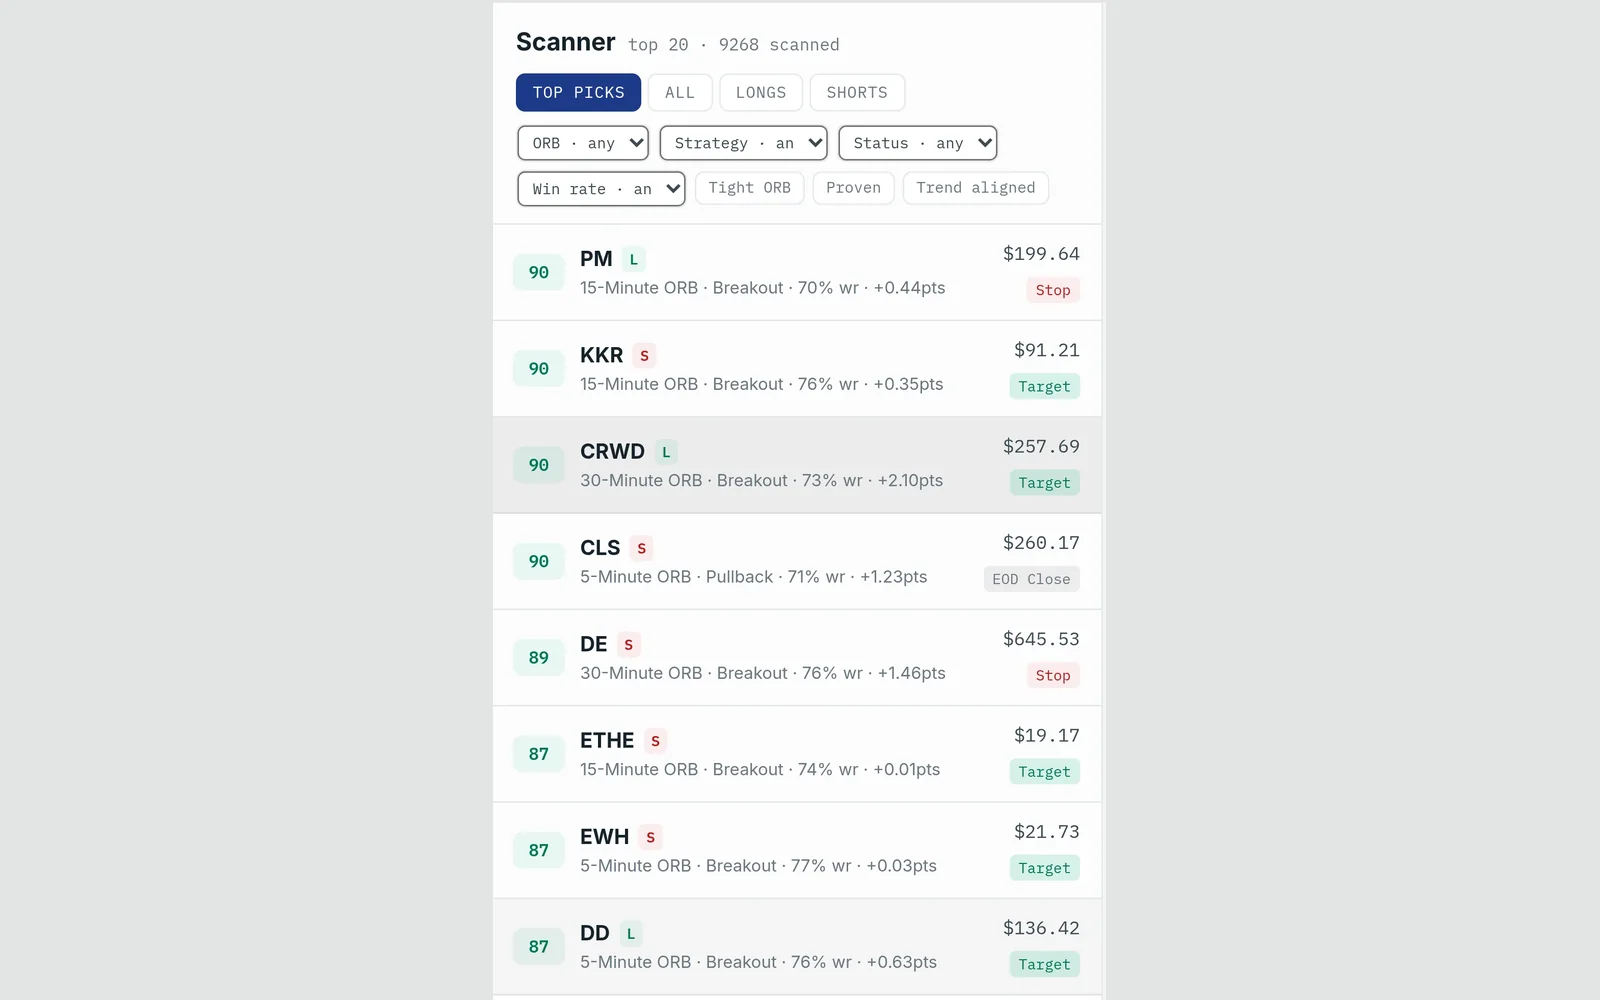
Conviction score
Each setup ranked by its historical win rate, trade expectancy and directional bias.
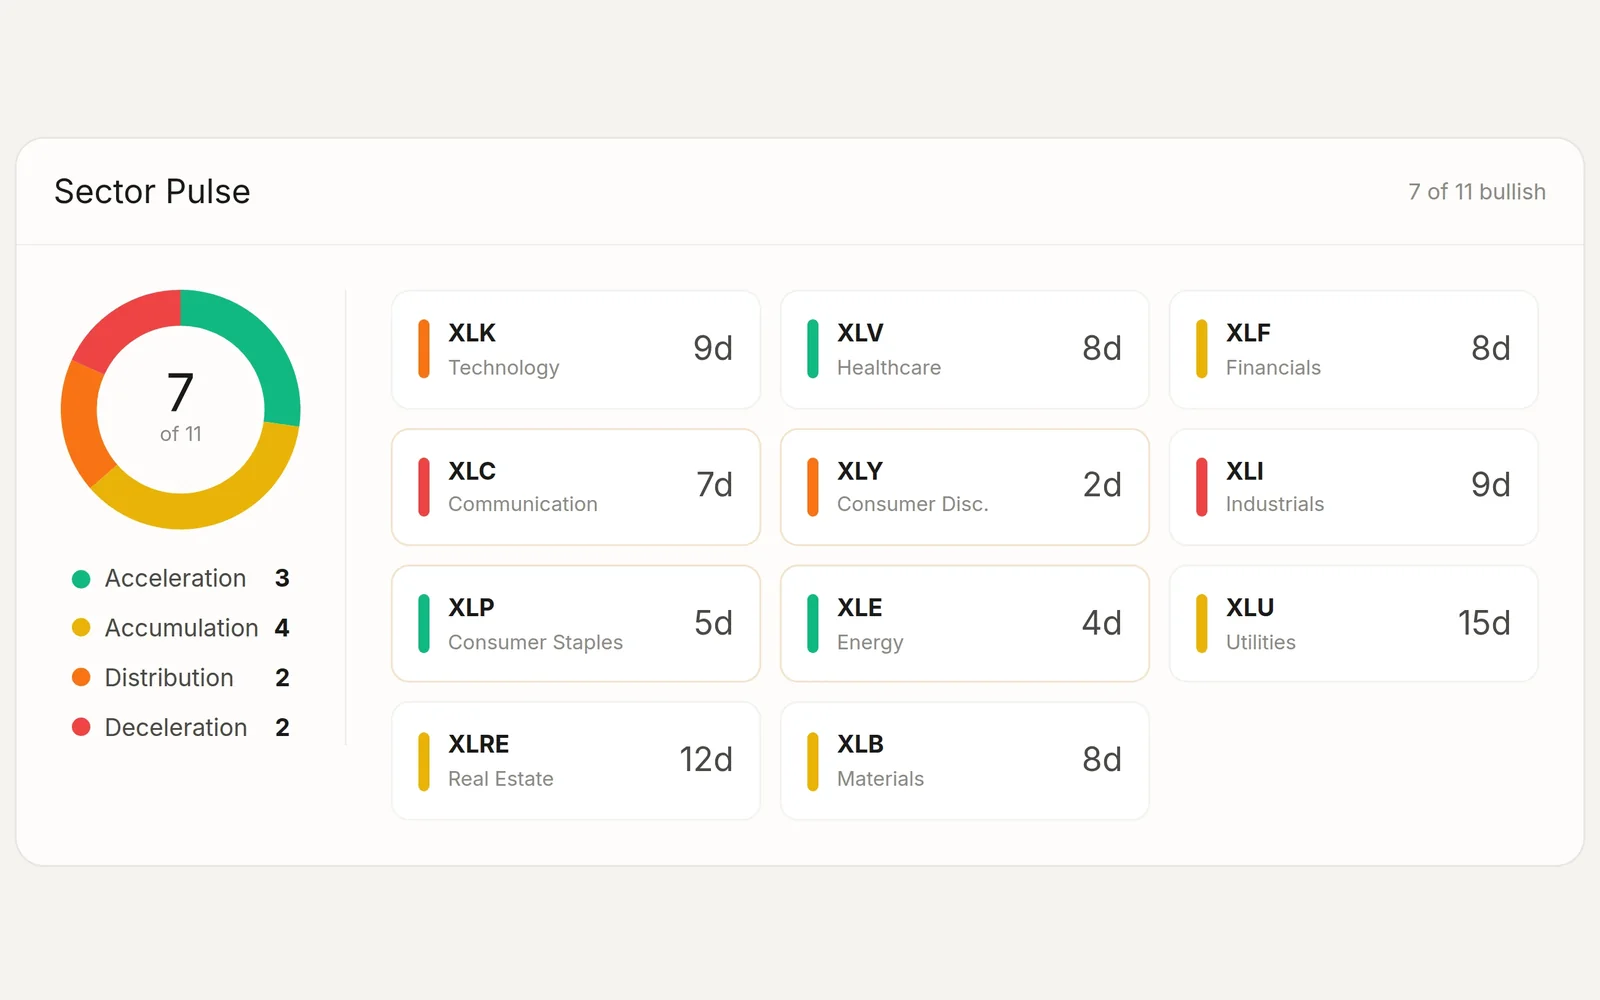
Market Pulse
SPY, QQQ and the sector ETFs placed in one of four market stages, so you know your bias before the bell.
How it works
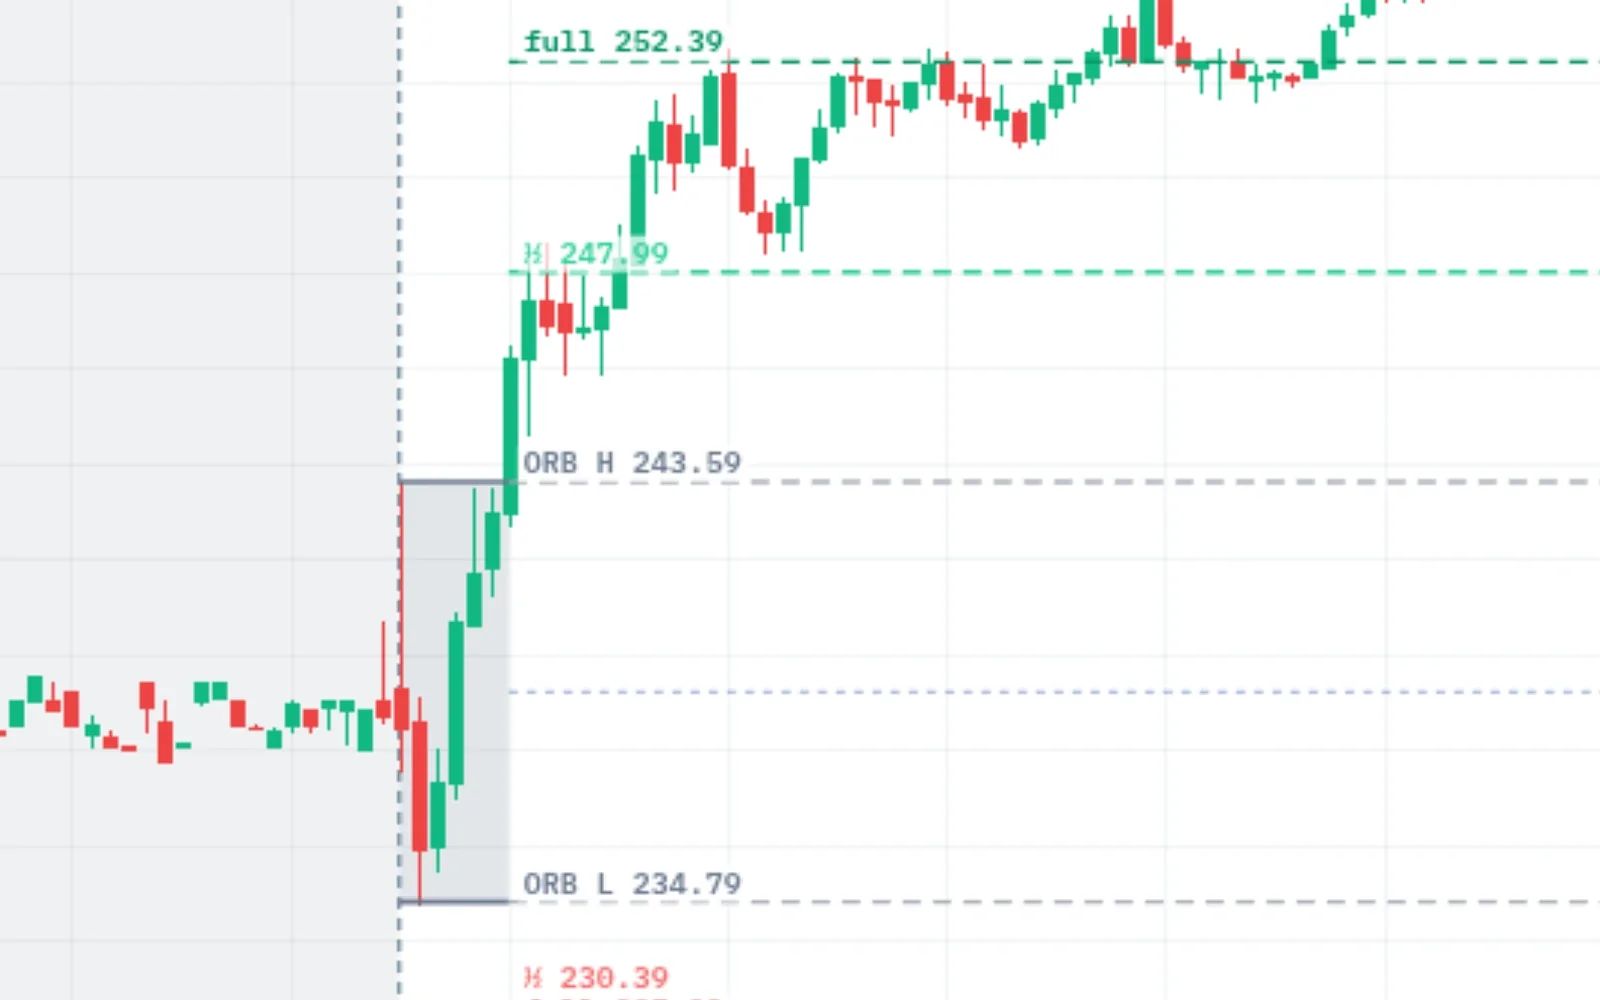
The range sets
The scanner records each symbol's high and low over the first 5, 15 and 30 minutes of the session.
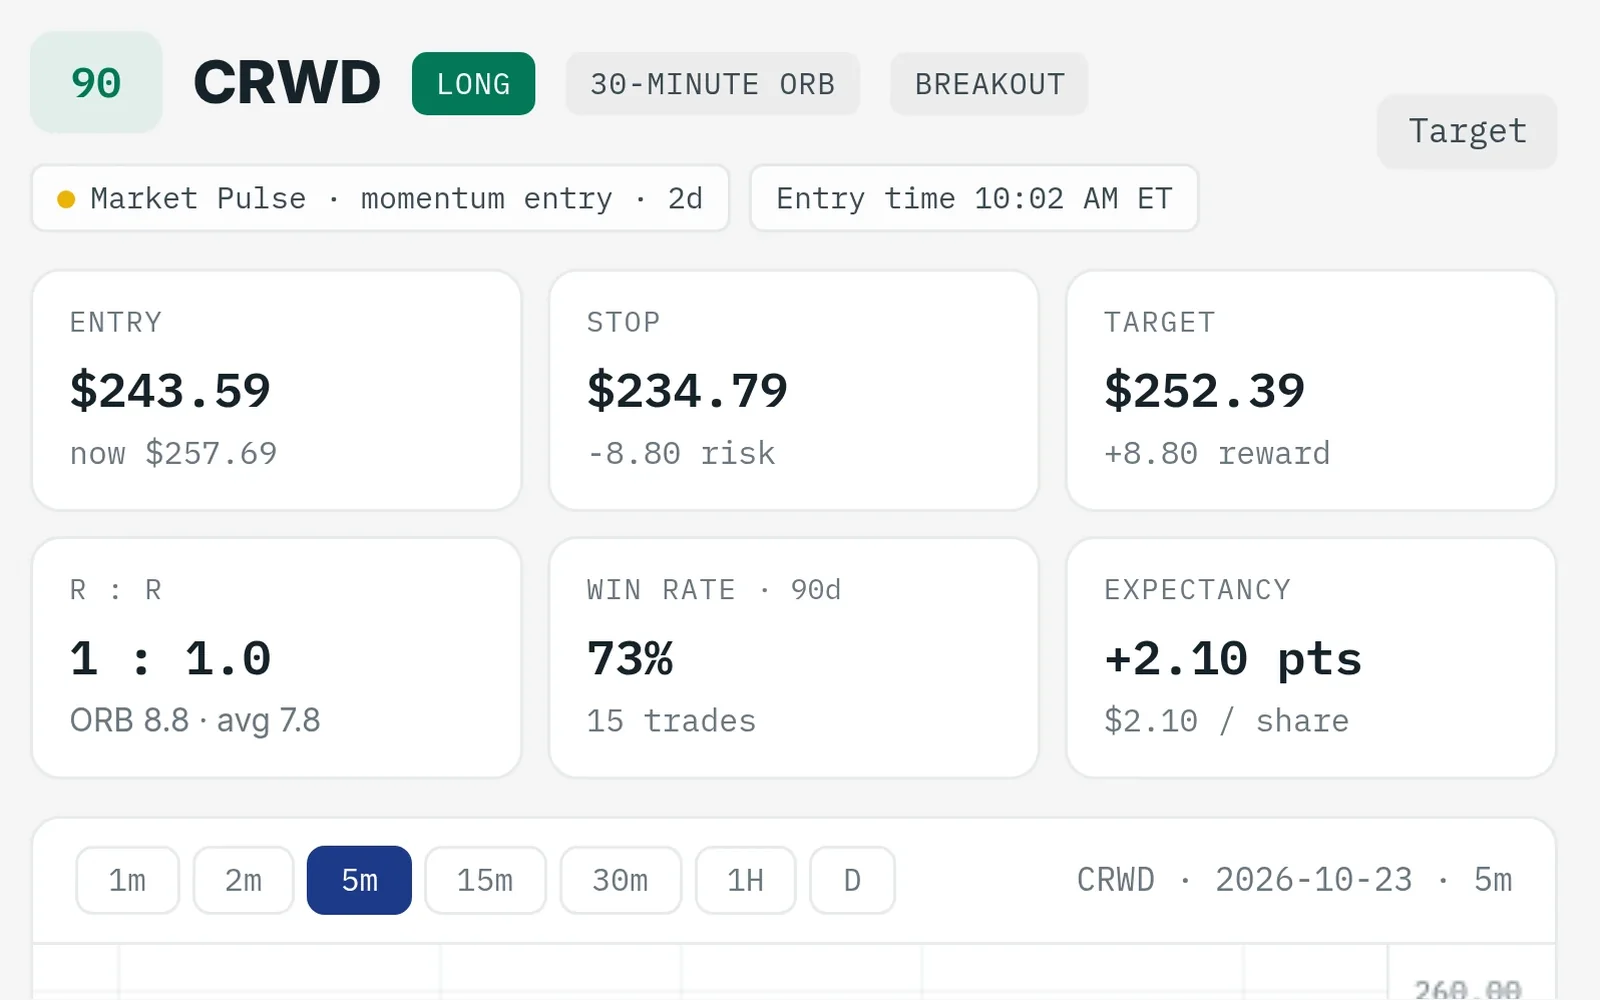
The break triggers
When price breaks the range, the setup appears with its entry, stop, target, 90-day win rate and conviction score.
Check the record
Before you take it, open that symbol, range and strategy in the backtester for its win rate, expectancy and cumulative P/L.
The platform
Screens from the ORB Setups app. Backtest figures describe past trades. Results vary, and past results do not guarantee future ones.
Videos
The 6-part ORB series
From the strategy to a daily routine, July 2025.
 Opening Range Breakout Strategy ExplainedPart 1
 How to Find ORB Trades: Scanner TutorialPart 2
 ORB Breakout vs. Pullback Strategy: Which Is Better?Part 3
 How to Backtest ORB Trades: Instant StatsPart 4
 ThinkOrSwim ORB Setup: Charts and IndicatorsPart 5
 My Daily ORB Trading Routine, Step by StepPart 6
Recent ORB research
From our channel, newest first.
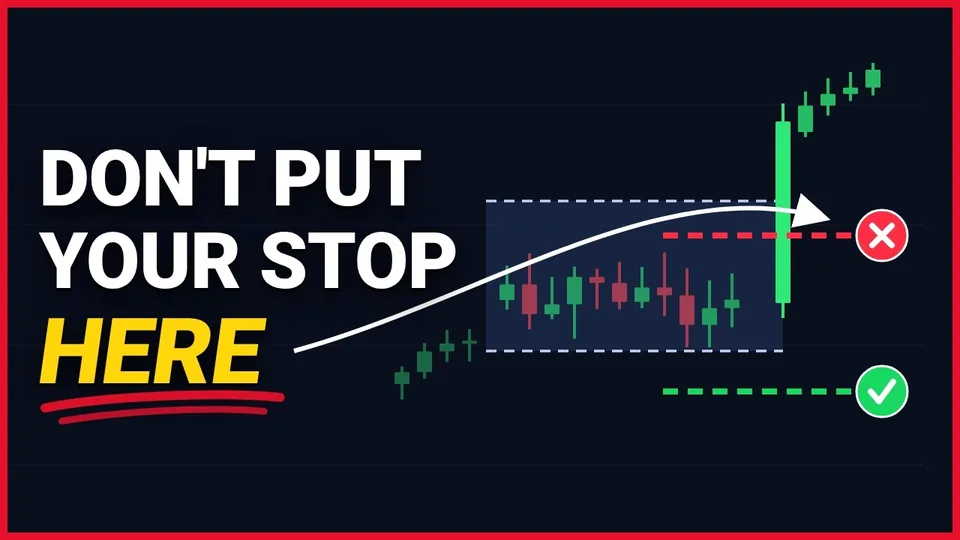 The "Safe" ORB Stop Loss That Lost $453,000Sep 5, 2026
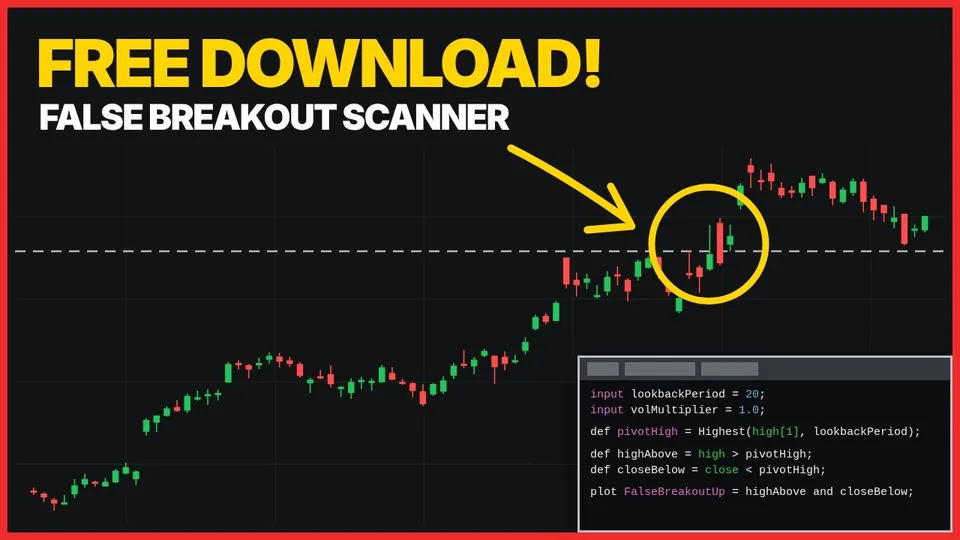 I Built a ThinkOrSwim Scanner for False BreakoutsSep 1, 2026
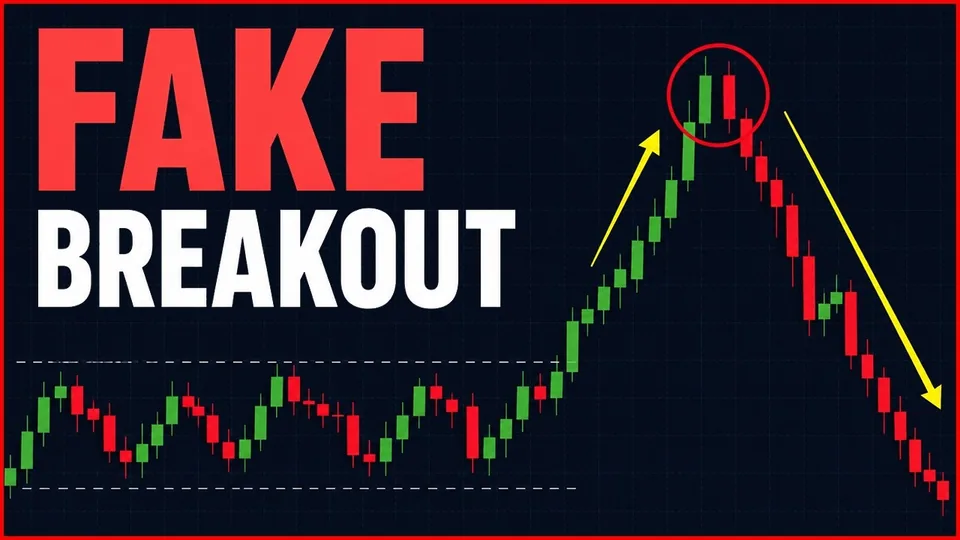 How to Use Data to Trade False Opening Range BreakoutsMay 29, 2026
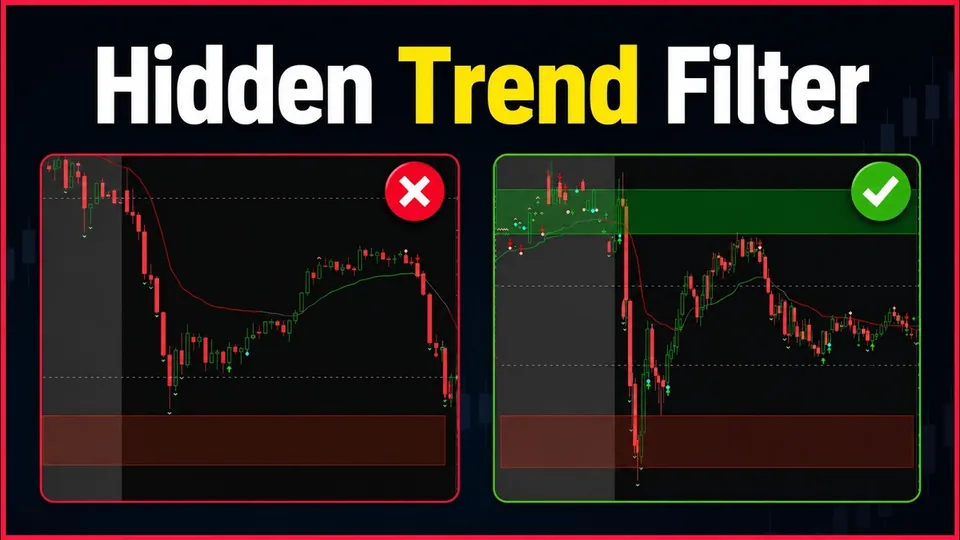 How to Know Which Stock to Trade When Multiple TriggerMay 27, 2026
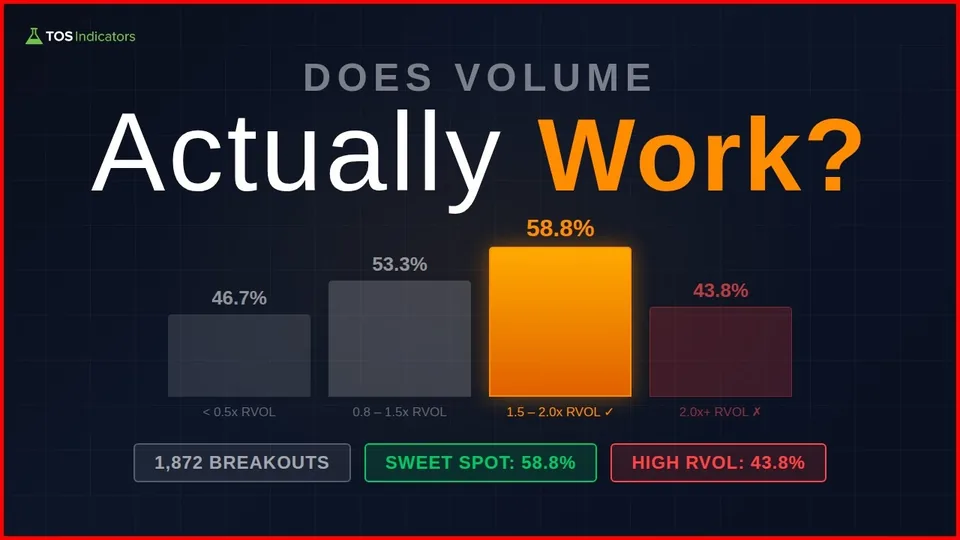 I Backtested 1,872 Breakouts. Does Volume Actually Work?Mar 31, 2026
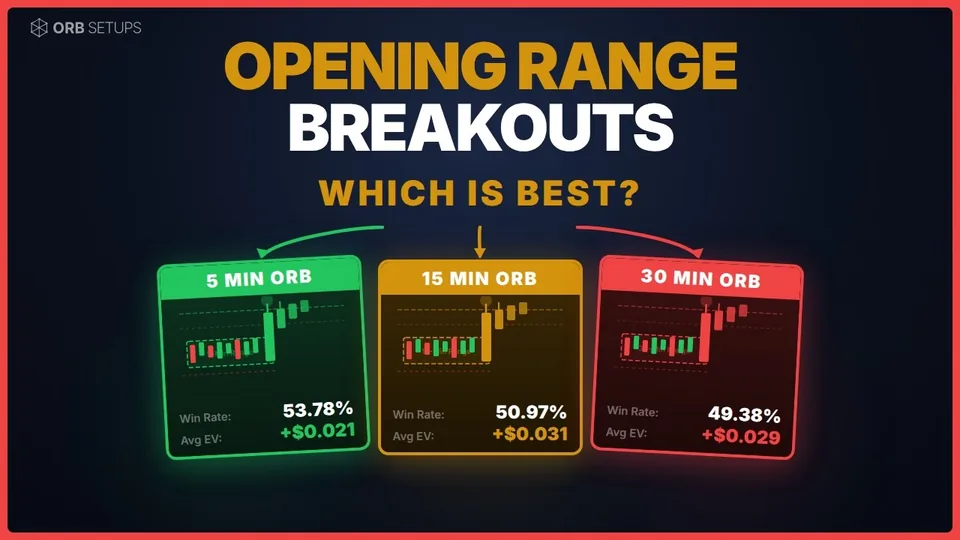 I Backtested 1,178,668 Opening Range Breakout TradesMar 20, 2026
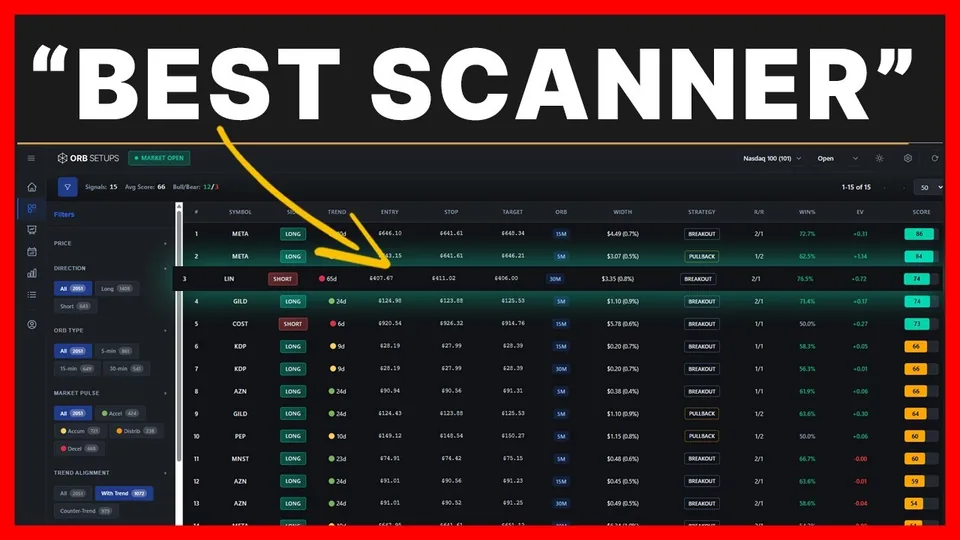 How to Find Opening Range Breakouts EasilyDec 3, 2025
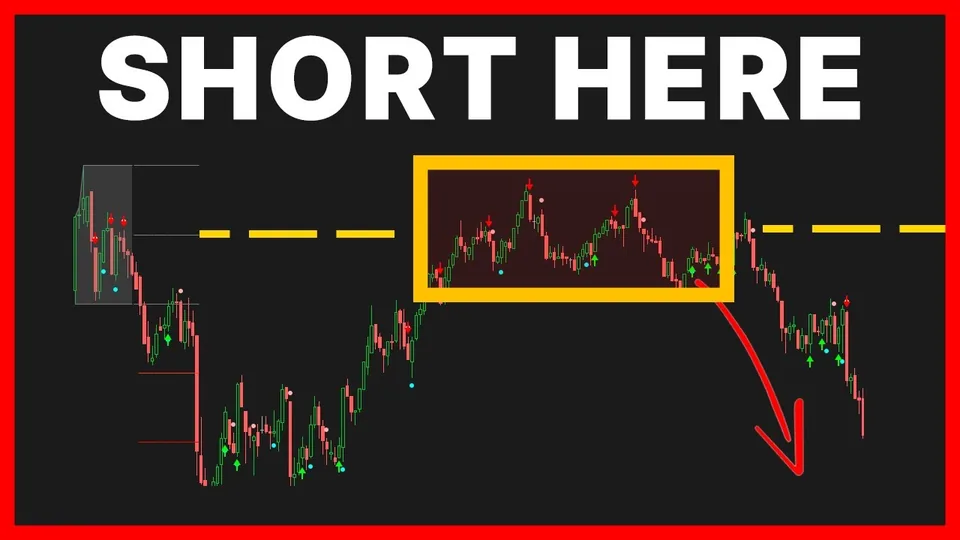 How to Trade Opening Range Breakouts With Volatility LevelsJul 16, 2025
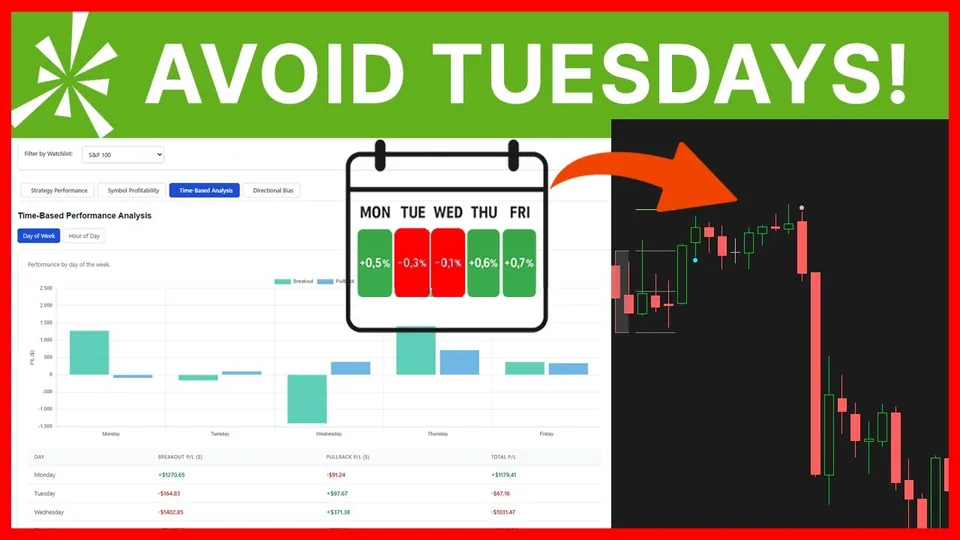 The Best Days to Trade Opening Range BreakoutsMay 21, 2025
Earlier videos
Setups, studies and platform demos, 2023 to 2025.
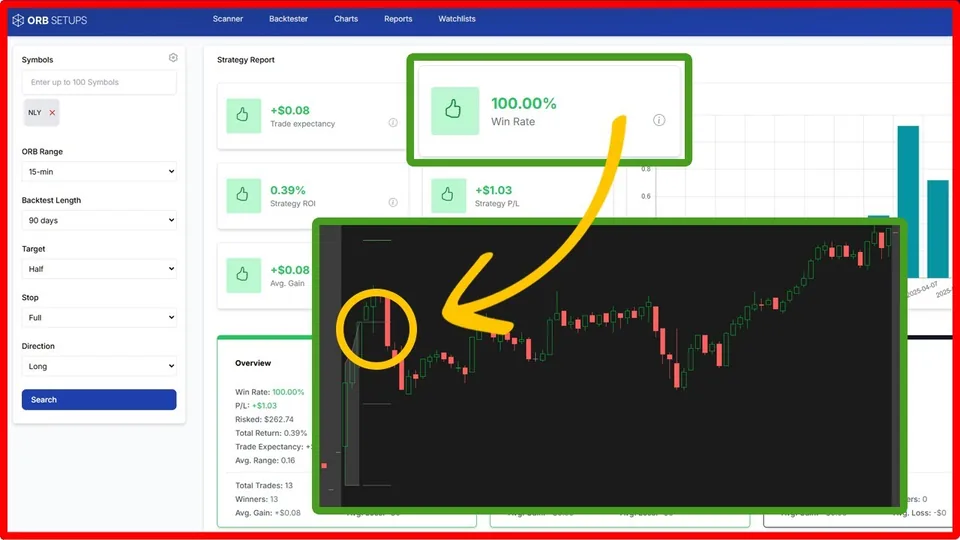 The Opening Range Breakout Setups That Keep WorkingApr 22, 2025
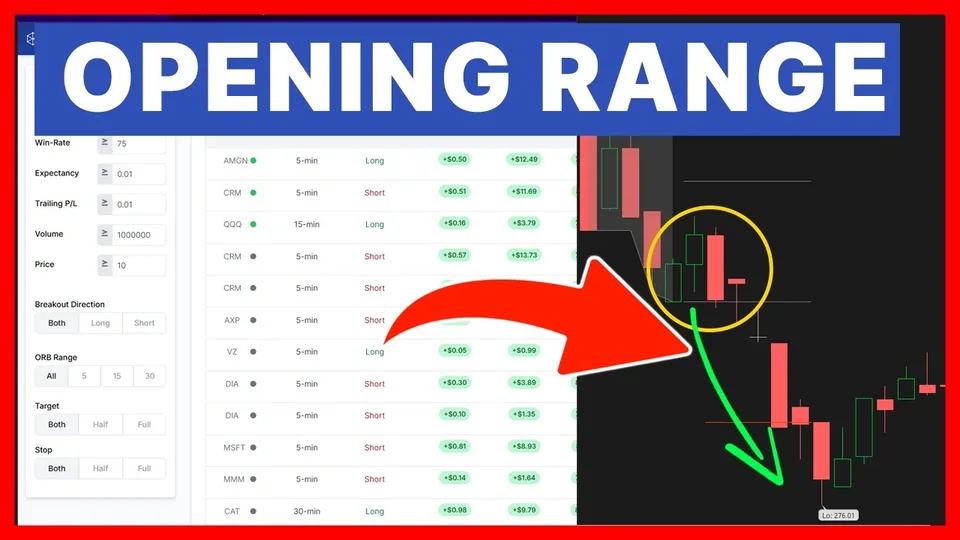 How I Use the ORB Scanner to Find the Best BreakoutsMar 27, 2025
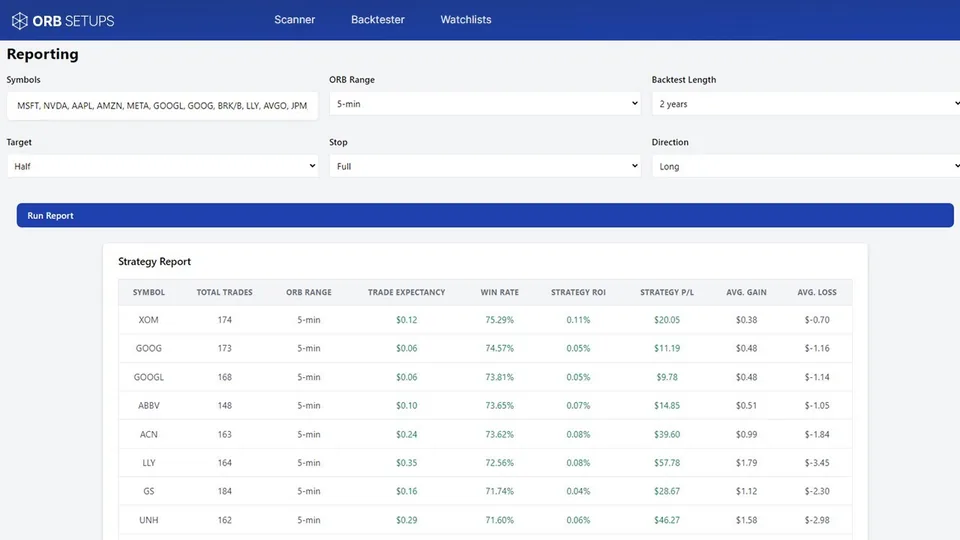 Instant ORB Reports for 500+ SymbolsJun 11, 2024
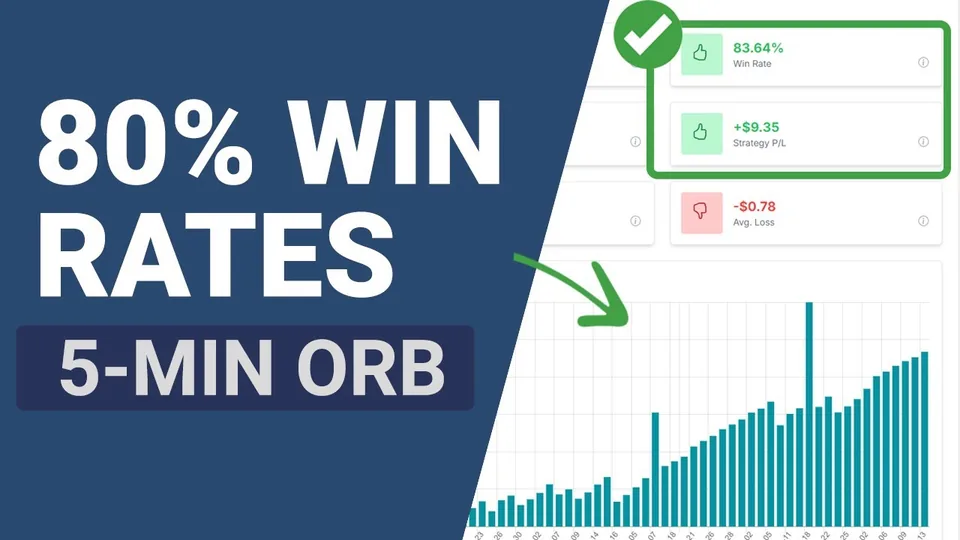 Best Performing Opening Range Breakout of 2024May 14, 2024
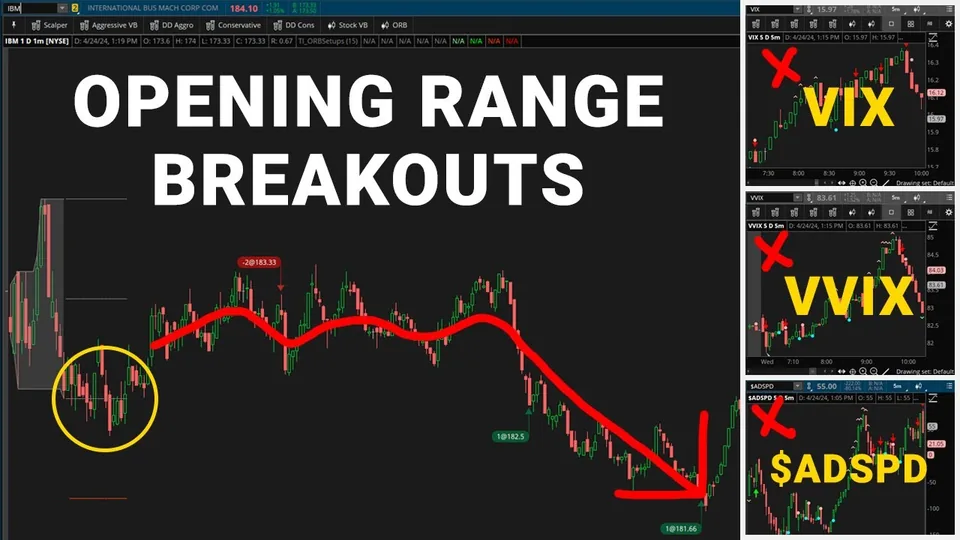 Using the VIX to Choose an ORB StrategyApr 25, 2024
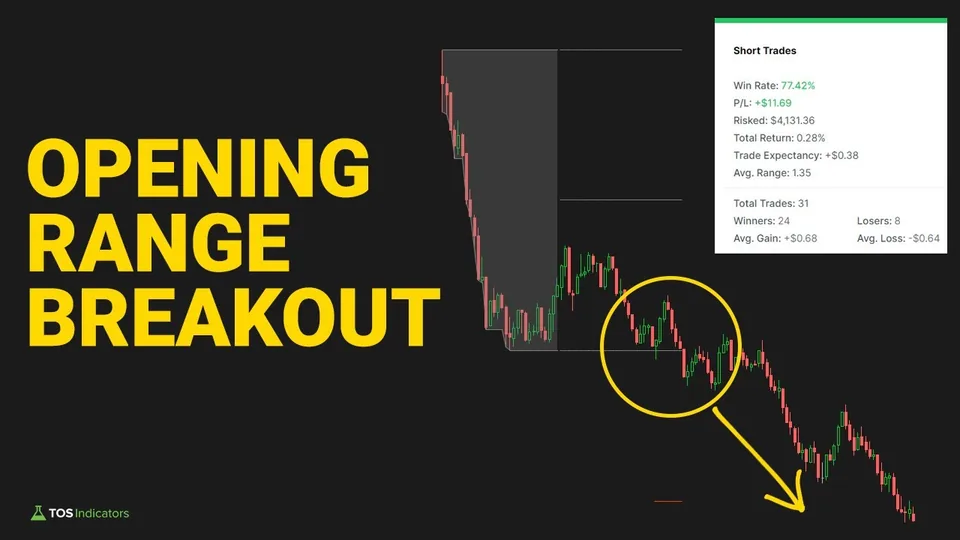 Opening Range Breakout Setup in AMZNNov 16, 2023
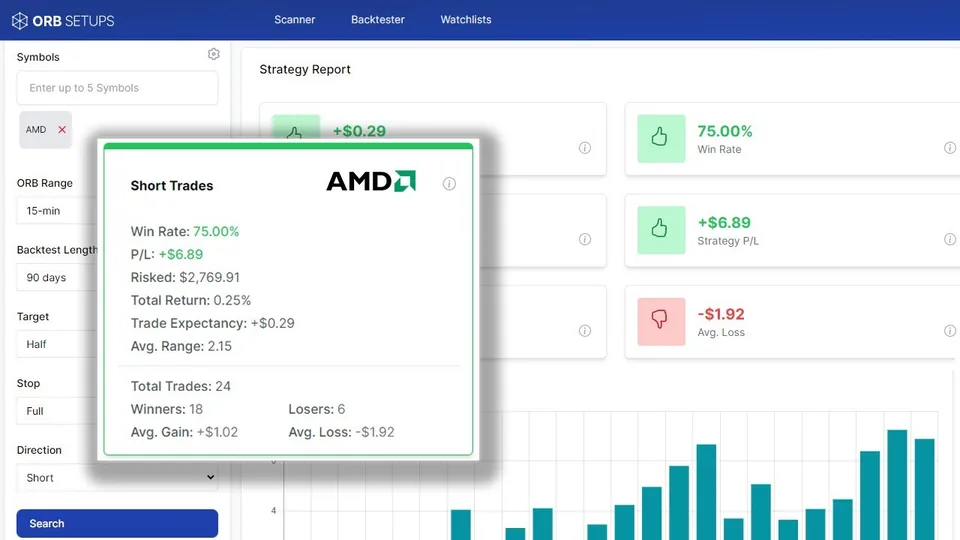 Opening Range Breakout Setup in AMDAug 15, 2023
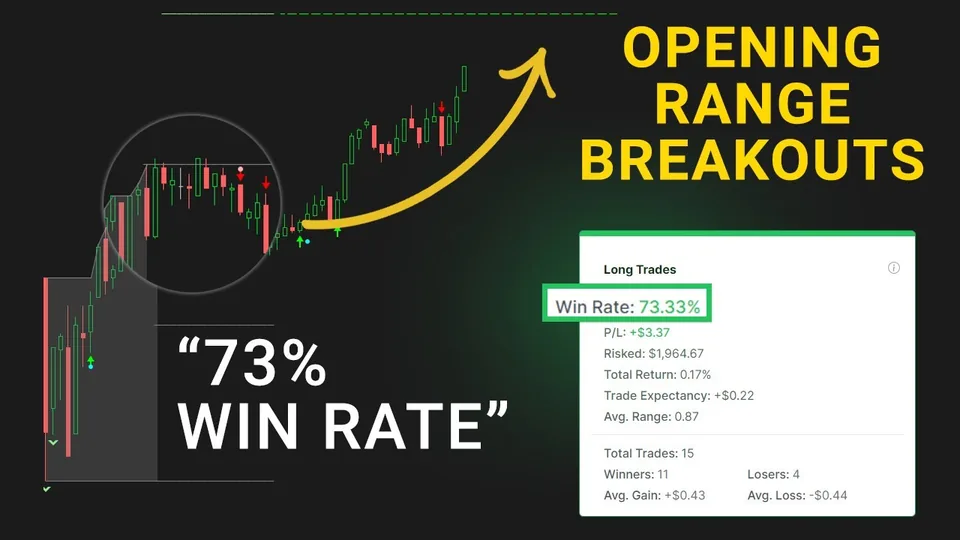 30-Minute ORB Strategy in IBM With a 73% Win RateJul 5, 2023
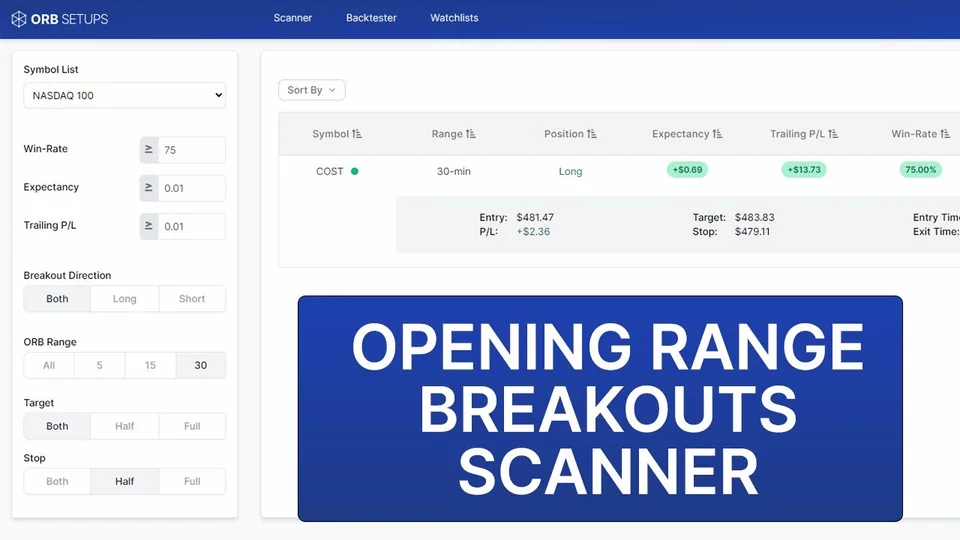 How to Find Opening Range Breakouts With Real-Time BacktestsMay 25, 2023
ORB Setups is in the Bundle
The Bundle adds Stock VB, Futures VB and Squeeze Setups, the Squeeze Course and every members-only indicator, for $253.50 a month.
Questions
What is ORB Setups?
Our opening range breakout scanner. It watches 640+ stocks and ETFs for breaks of the 5, 15 and 30-minute opening ranges, and every setup shows its entry, stop, target and that symbol's own win rate.
How does ORB Setups find trades?
It scans for stocks breaking above or below their opening range, calculates the entry, stop and targets for each setup, and shows the backtest record for that exact symbol and timeframe from 2 years of 1-minute data.
How often does the scanner refresh?
Every 2 minutes during market hours.
What is in the backtester?
625,000+ historical opening range breakouts built on 2 years of 1-minute candles. Query any symbol, timeframe or strategy to see win rate, expectancy and cumulative P/L.
Why show each symbol's own win rate?
Because the average breakout is close to a coin flip: across 625,000+ backtested trades it won 52% of the time. The edge, when there is one, is in the specific symbol, range and direction.
Do I need ThinkOrSwim?
No. ORB Setups runs in any browser. If you want the opening range on your ThinkOrSwim chart too, the free Opening Range Breakout indicator draws it.
Can I cancel?
Yes, from your account at any time. You keep access until the end of the billing period.
Other products
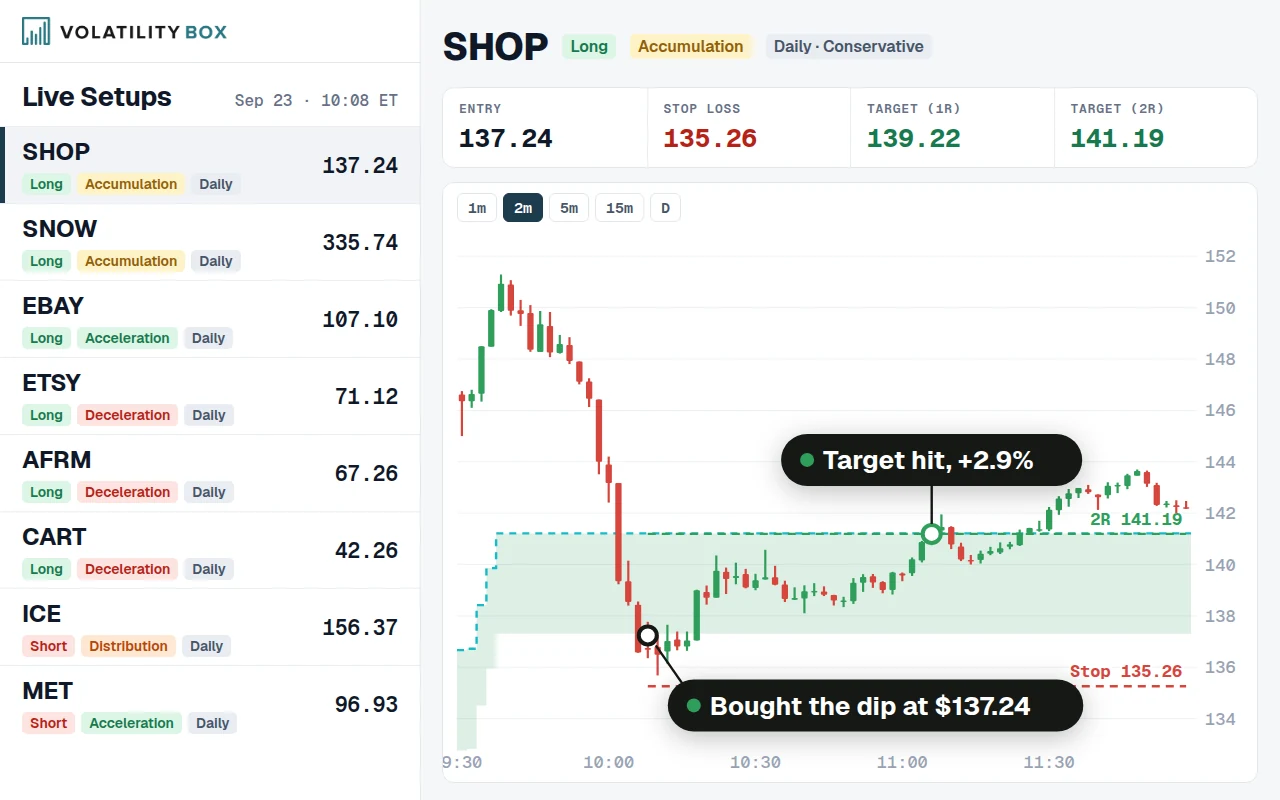 Stock Volatility Box$169 a month. Daily and hourly volatility zones for 644 stocks and ETFs, with a live scanner and a backtester.
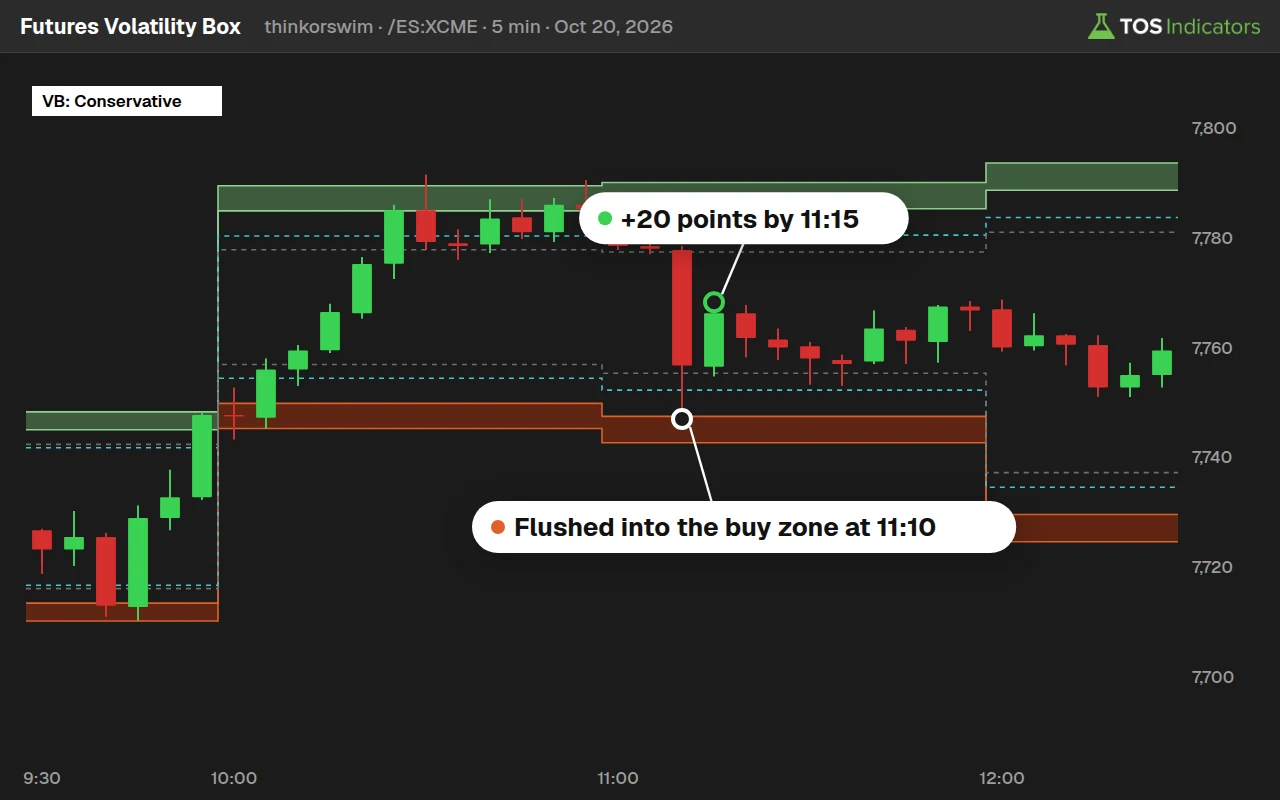 Futures Volatility Box$169 a month. 5 hourly models for 10 futures markets, the micros and SPX, for ThinkOrSwim and TradingView.
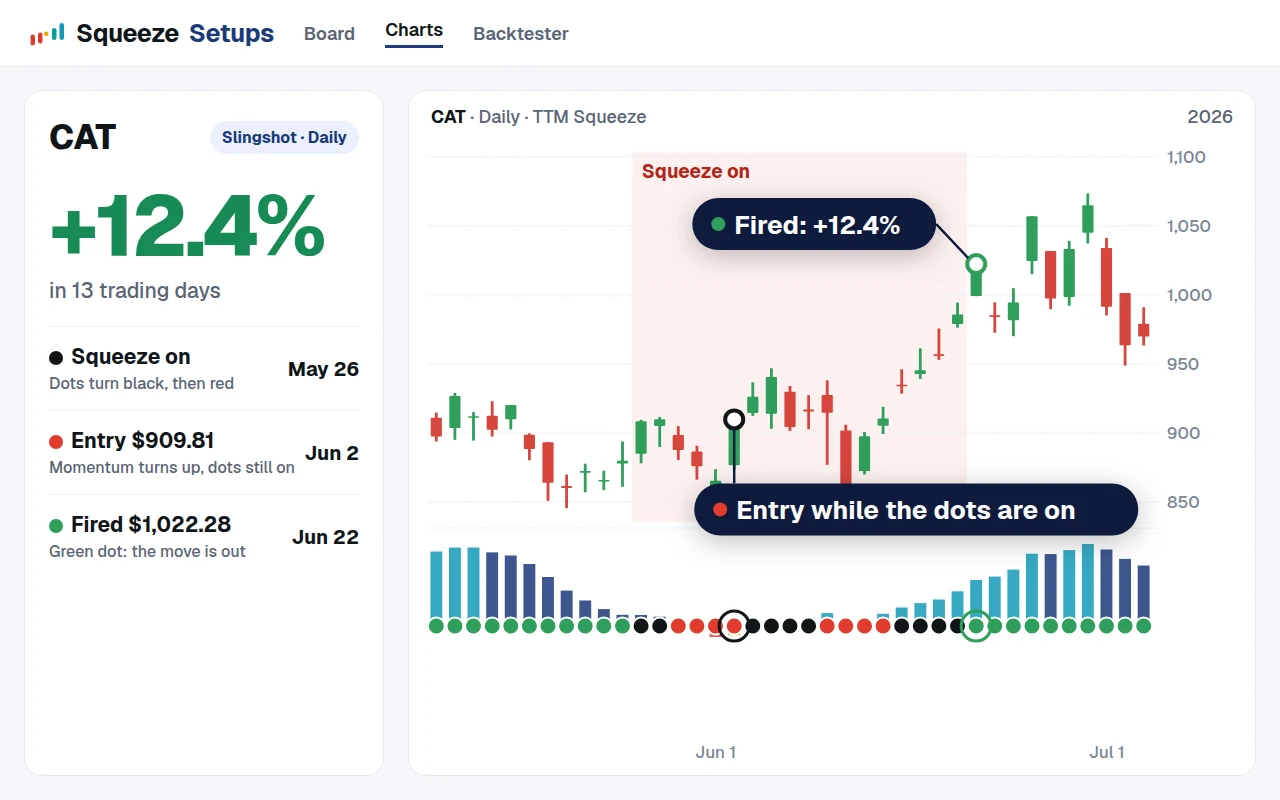 Squeeze Setups$99 a month. A live squeeze board on 600+ stocks and 12 timeframes, ranked by each name's backtest.
Get ORB Setups
$99 a month. Cancel anytime, no contracts, and your price stays the same as long as you stay subscribed.