
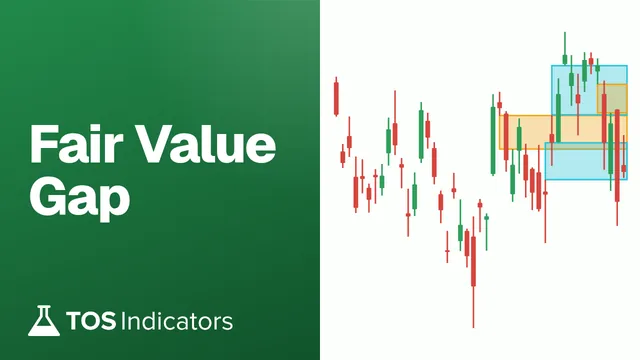
 Fair Value Gap
 False Breakout Scanner
 Heiken Ashi Trend

 Stock Volatility Box
 Futures Volatility Box
 ORB Setups
 Squeeze Setups
On this page
What is a fair value gap?
A fair value gap is a three-candle pattern. Candle 2 moves so fast that candle 1's high and candle 3's low don't overlap. The empty space between them is the fair value gap. Price ran through that area so quickly that almost nothing traded there.
The bearish version is the same pattern flipped. Candle 3's high sits below candle 1's low, and candle 2 is the fast candle again. In thinkScript, candle 3 is the current bar and candle 1 is 2 bars back, so each side comes down to one comparison: low > high[2] for a bull gap and high < low[2] for a bear gap.
What 116,307 fair value gaps did next
Before writing the indicator, I measured every fair value gap on 650 stocks and ETFs, using daily bars from October 2015 to October 2026. Move the filter to see how gap width changes what happens after the gap. The indicator's minGap input works the same way.
First-retest hold rate, by gap width
Width in ATRs. Bars at or above minGap are the gaps the indicator shows.
Touched and filled, days after the gap
touched filled dashed = all gaps, no filter
Holding is not the same as profit. Five trading days after the first retest, wide bull gaps that held returned +0.56% on average, and 52.9% were positive, about the same as gaps that broke. Use a gap to decide where to look. Use something else to decide when to act.
How this was measured
Universe: 650 stocks and ETFs from our daily bar table, Oct. 27, 2015 to Oct. 12, 2026. A bull gap forms on bar i when low[i] > high[i−2]; the zone runs from high[i−2] to low[i]. Bear gaps mirror it. Touched within N days: price trades back into the zone. Filled within N days: price trades through the far edge. Held on first retest: on the first day price touches the zone, the close is back beyond the far edge. ATR is the 14-bar simple average of true range on the gap bar. Each gap is followed for 20 trading days.
How to read the gaps on a chart
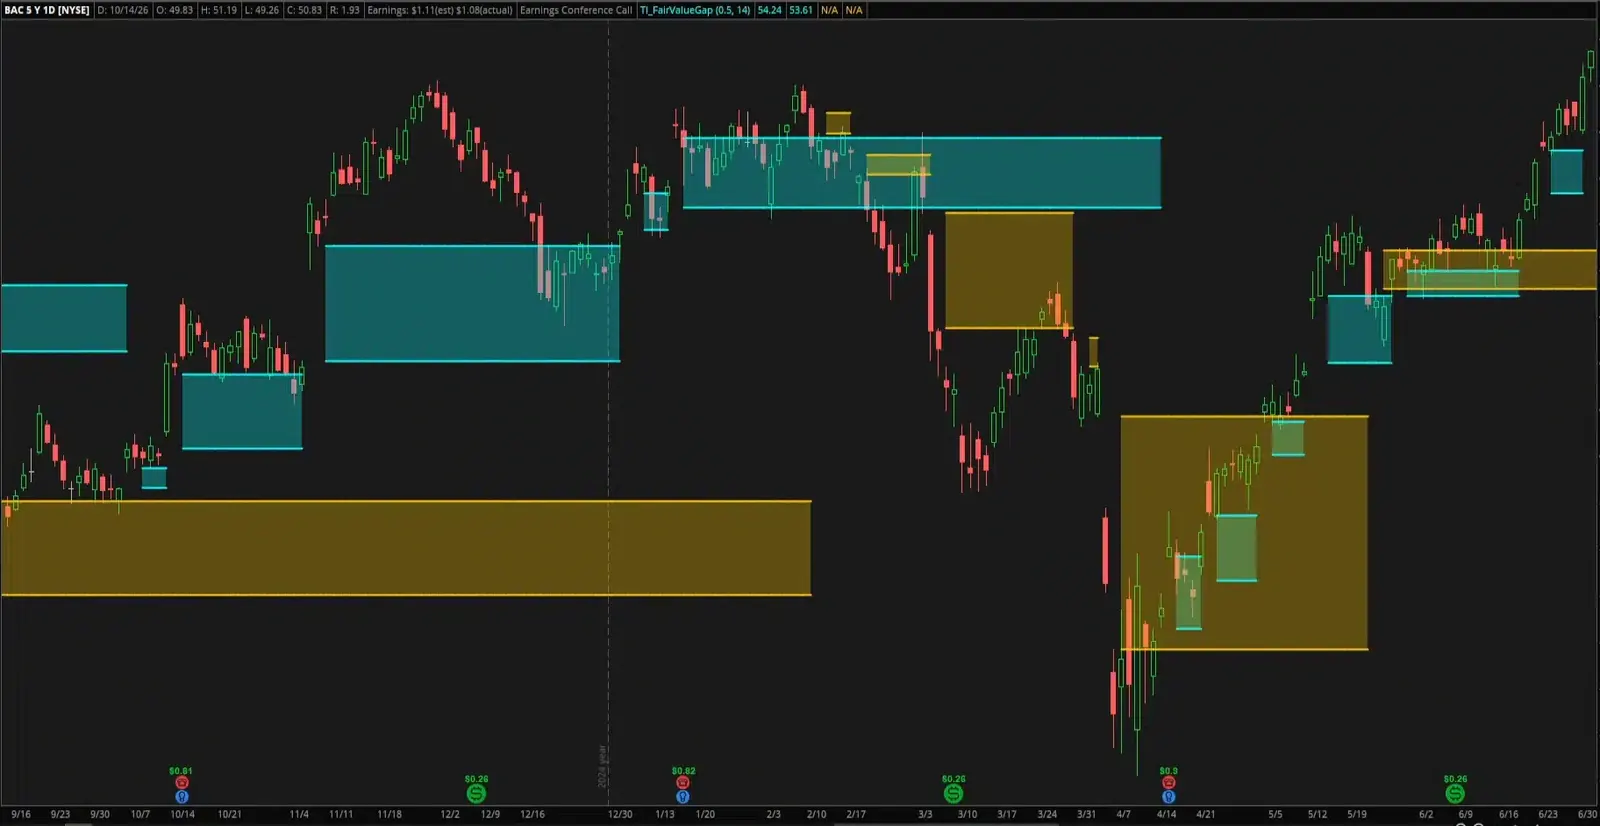
Here's what I look for on the Bank of America daily chart from the video.
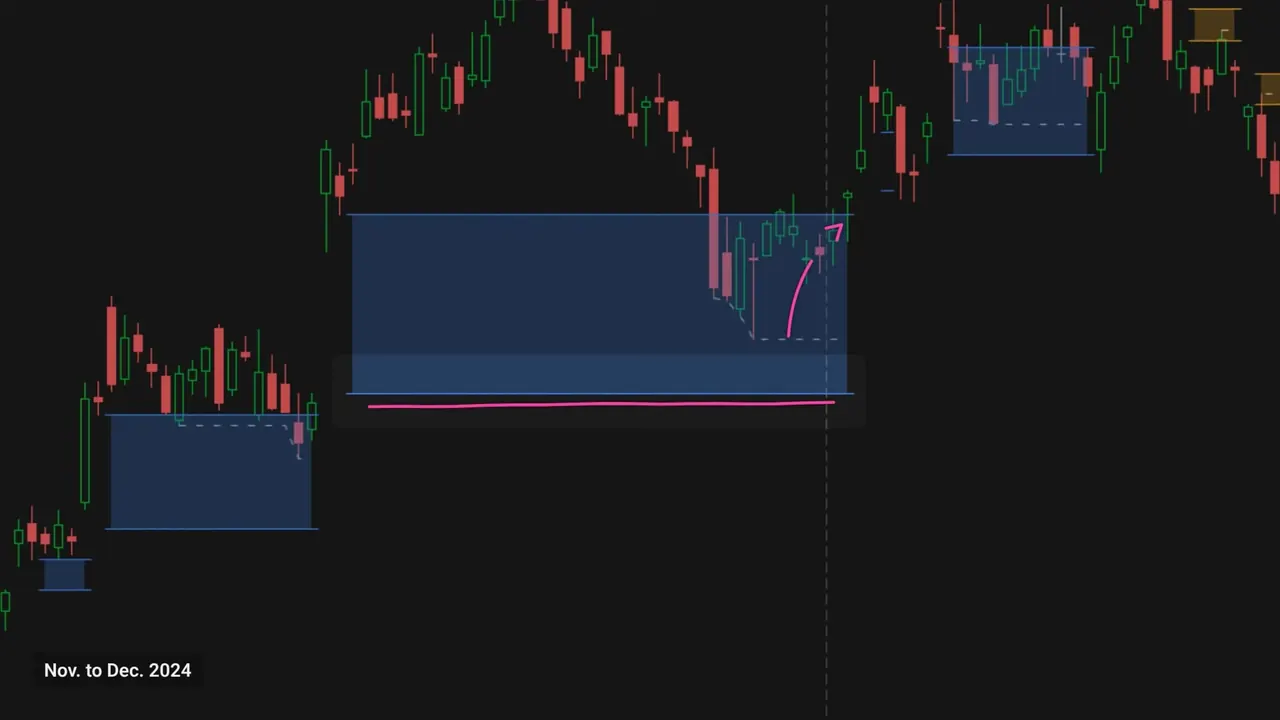
Bank of America left a bull gap behind on the November 2024 election rally. In December, price came back down into it, never closed below the bottom of the cloud, and turned back up.
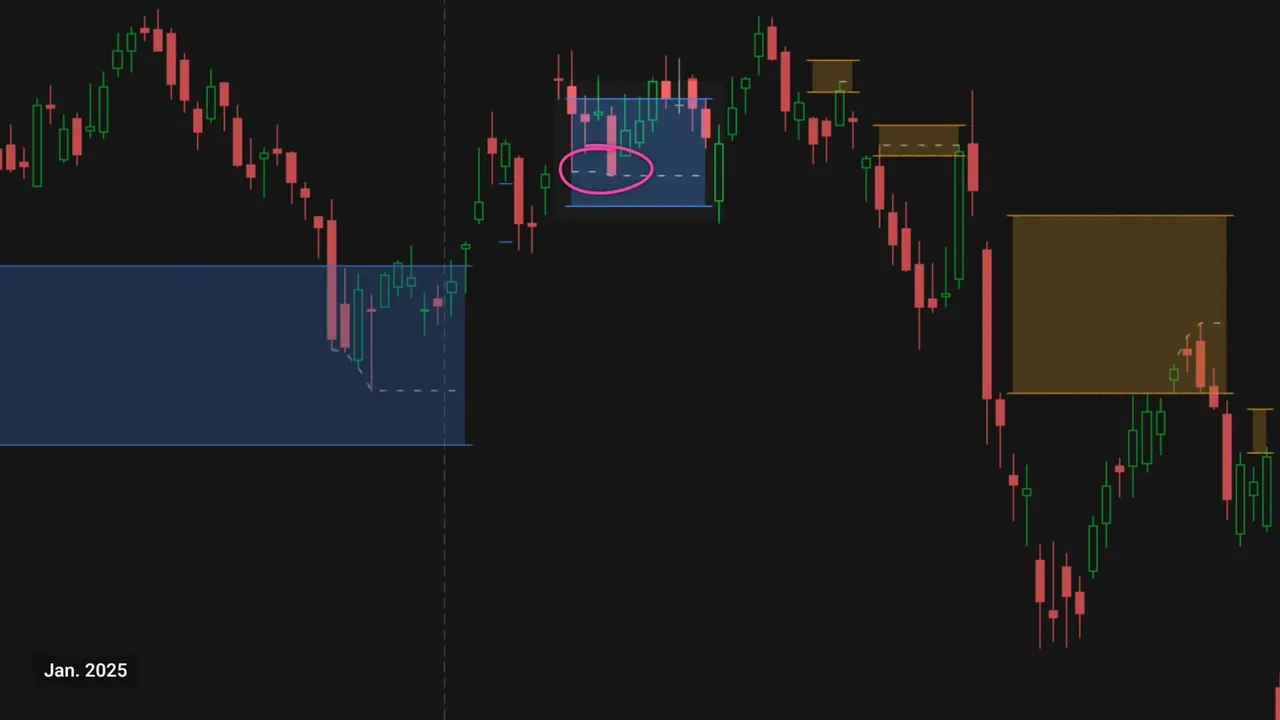
Another gap up, a pullback into the gap, the bottom held, and price bounced.
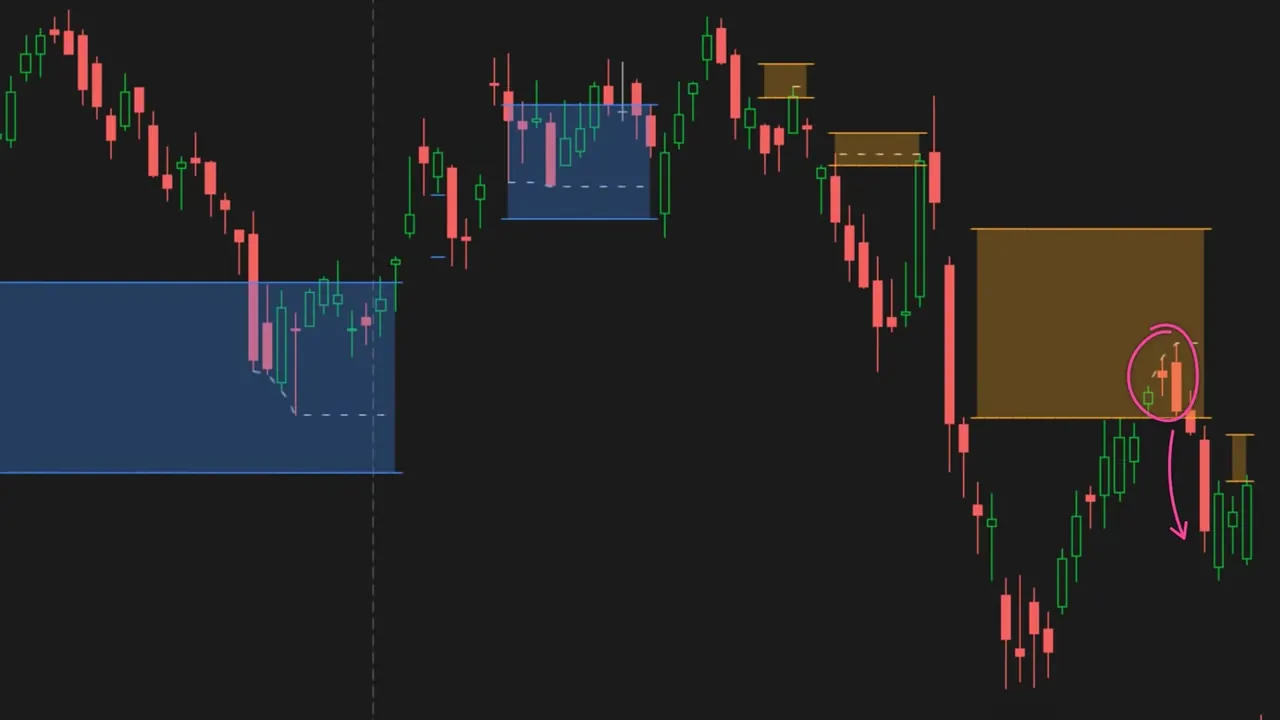
In February, price poked into 2 small bear gaps and was rejected quickly. The March bear gap was wider. Price climbed back into it at the end of March, stalled, and rolled over right before the April sell-off.
I use the gaps as levels to plan around. The data shows price comes back to them often, and the indicator shows exactly where they sit, so line up the retest with the rest of your setup before you take a trade.
How to install the indicator in ThinkOrSwim
- Download the indicator and open the .txt file, then copy all of the code. You can also copy it from the code block on this page.
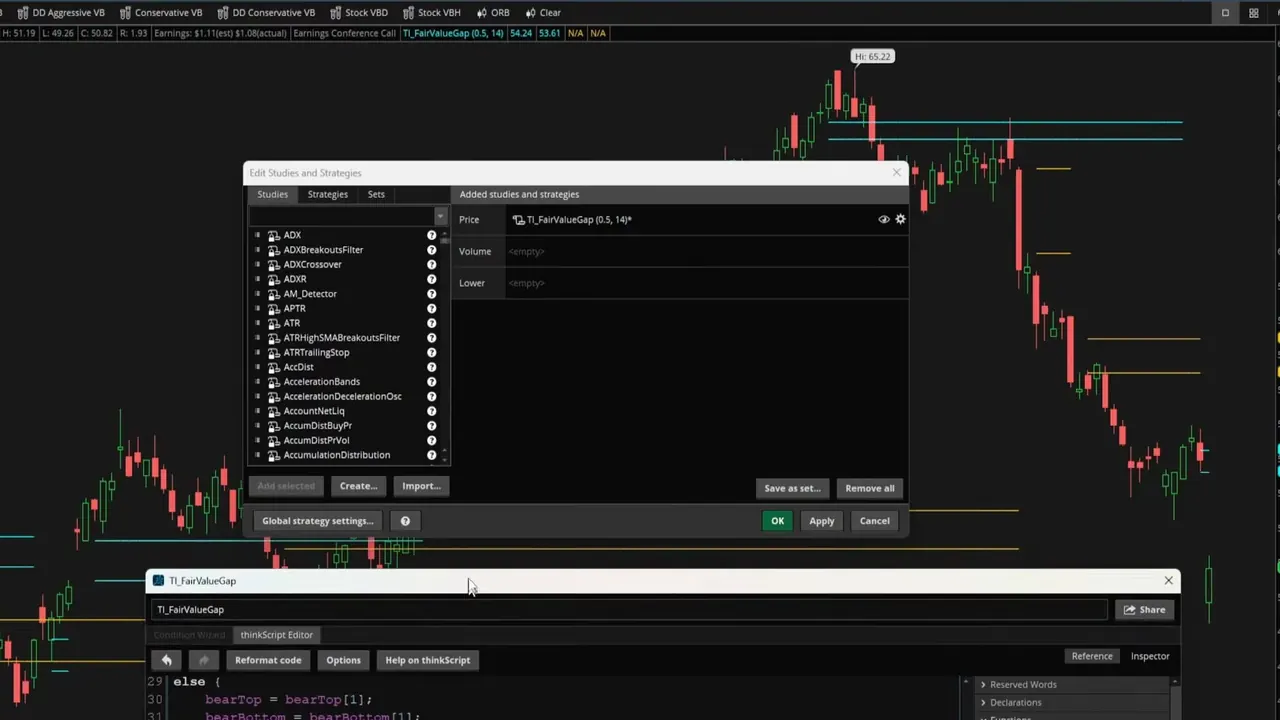
- In ThinkOrSwim, click the Studies icon, then click Create.
- Delete the placeholder code and paste in the fair value gap code.
- Name the study. I called mine
TI_FairValueGap. - Click OK, then Apply. Start on a daily chart, which is what the video and the study use.
New to custom studies? The walkthrough on how to import a thinkScript study into ThinkOrSwim covers the same steps with screenshots.
Inputs
| Input | Default | What it controls |
|---|---|---|
minGap | 0.5 | Minimum gap width, as a multiple of ATR. Raise it to see only wide gaps, lower it to see more of them. |
ATRLength | 14 | Number of bars in the ATR average that minGap is measured against. |
How the code works
Step 1: The ATR filter
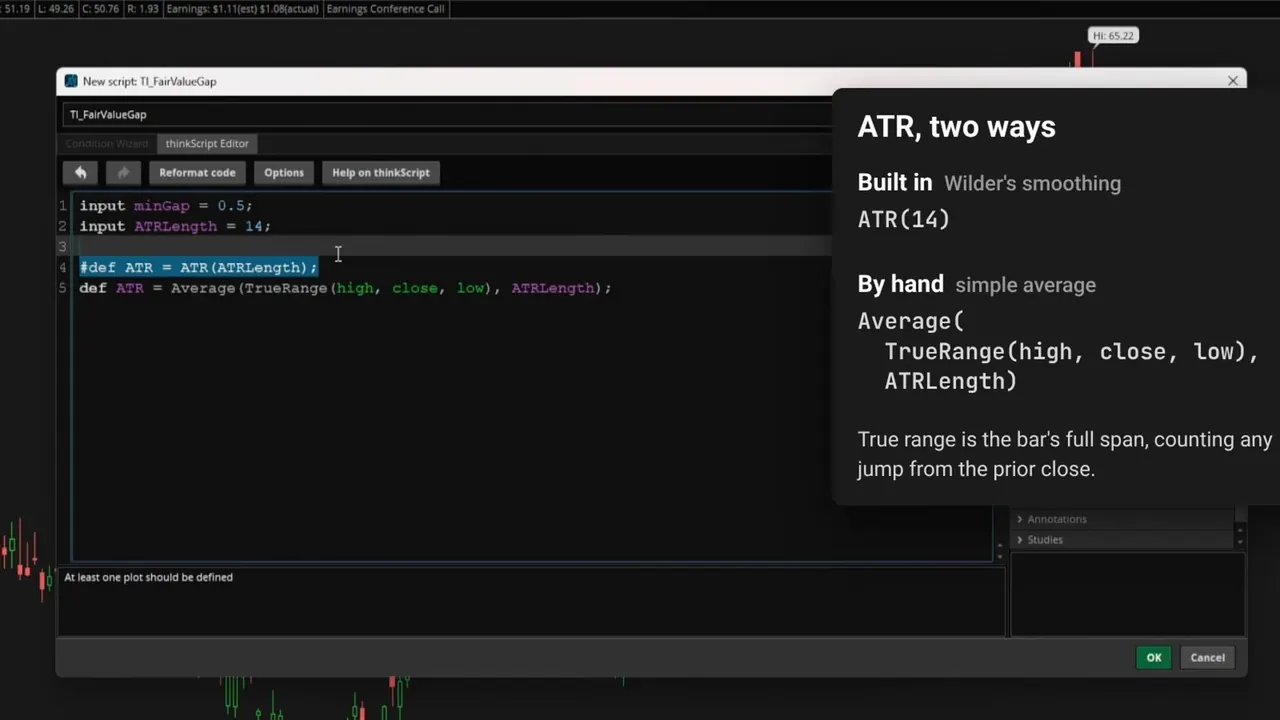
To tell a wide gap from a narrow one, I use ATR as the yardstick. ThinkOrSwim has a built-in ATR function you could call instead. I wrote it out with Average and TrueRange so you can see what it calculates, and pulled the length out as an input.
This step’s code is free with an account. Create one or sign in.
Step 2: Define bull and bear gaps
Each gap has two conditions. The candles can't overlap, and the gap has to be at least minGap times the ATR. With the default of 0.5, a gap has to be at least half the ATR on your current timeframe.
This step’s code is free with an account. Create one or sign in.
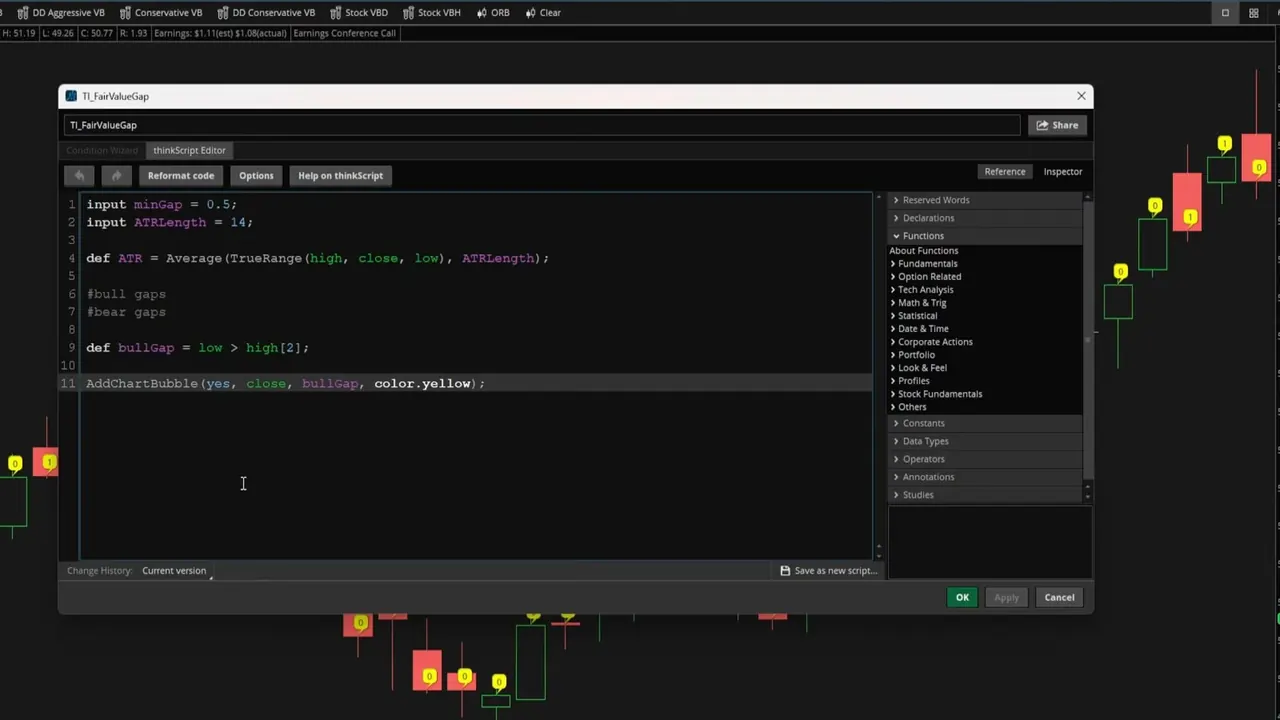
While building this, I used AddChartBubble to check that each gap showed up where I expected it. That line is still at the bottom of the code, commented out, if you want it for debugging your own changes.
Step 3: Carry the gap forward without arrays
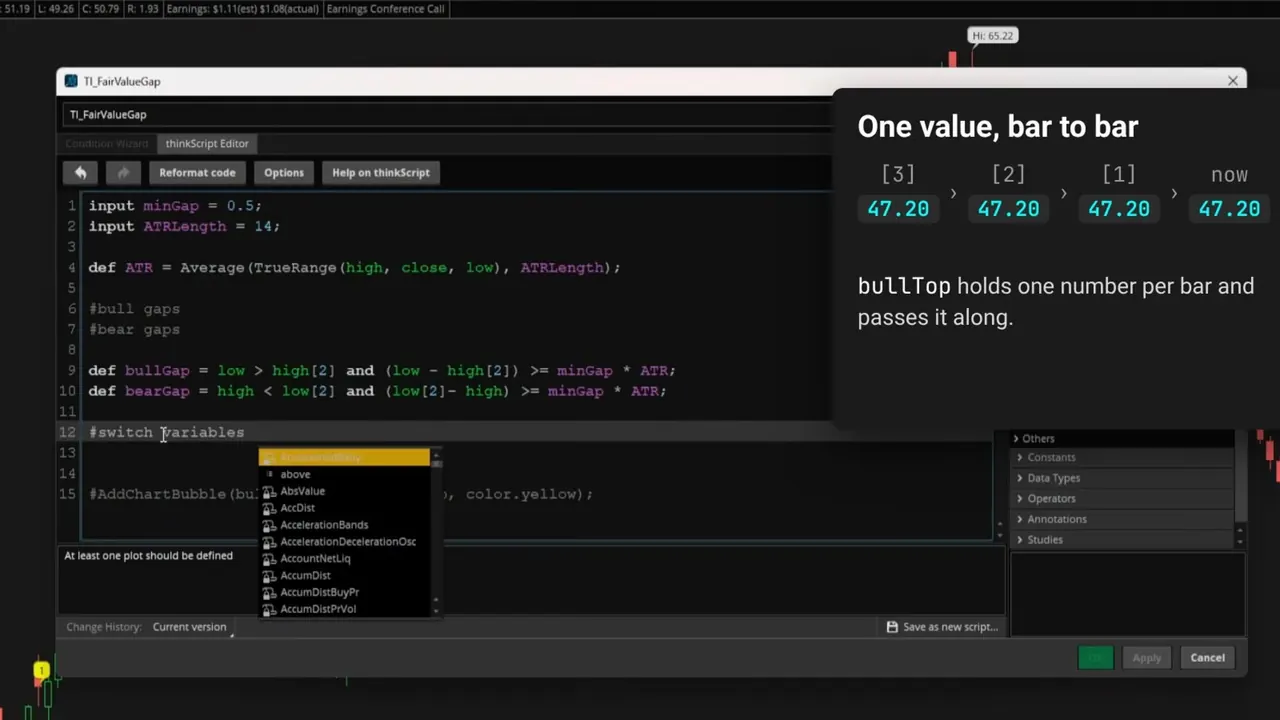
ThinkOrSwim doesn't have arrays, so I declare bullTop and bullBottom first and set them inside an if/else block. On the bar where a bull gap forms, the top is the current low and the bottom is the high from 2 bars ago. On every bar after that, each variable takes its value from the previous bar, which carries the gap forward.
This step’s code is free with an account. Create one or sign in.
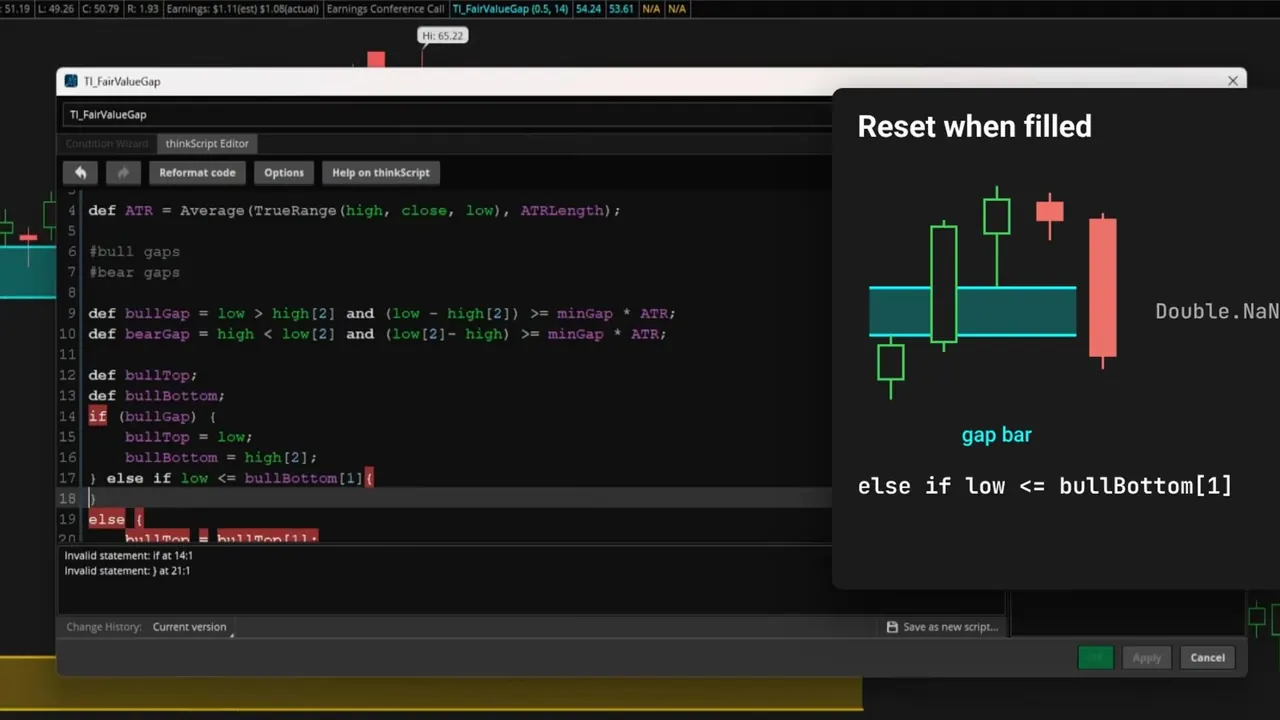
The middle branch clears the gap. Once the low trades down to the bottom of the bull gap, both values reset to Double.nan and the cloud comes off the chart. The bear side mirrors this.
Step 4: Plot the gaps as clouds
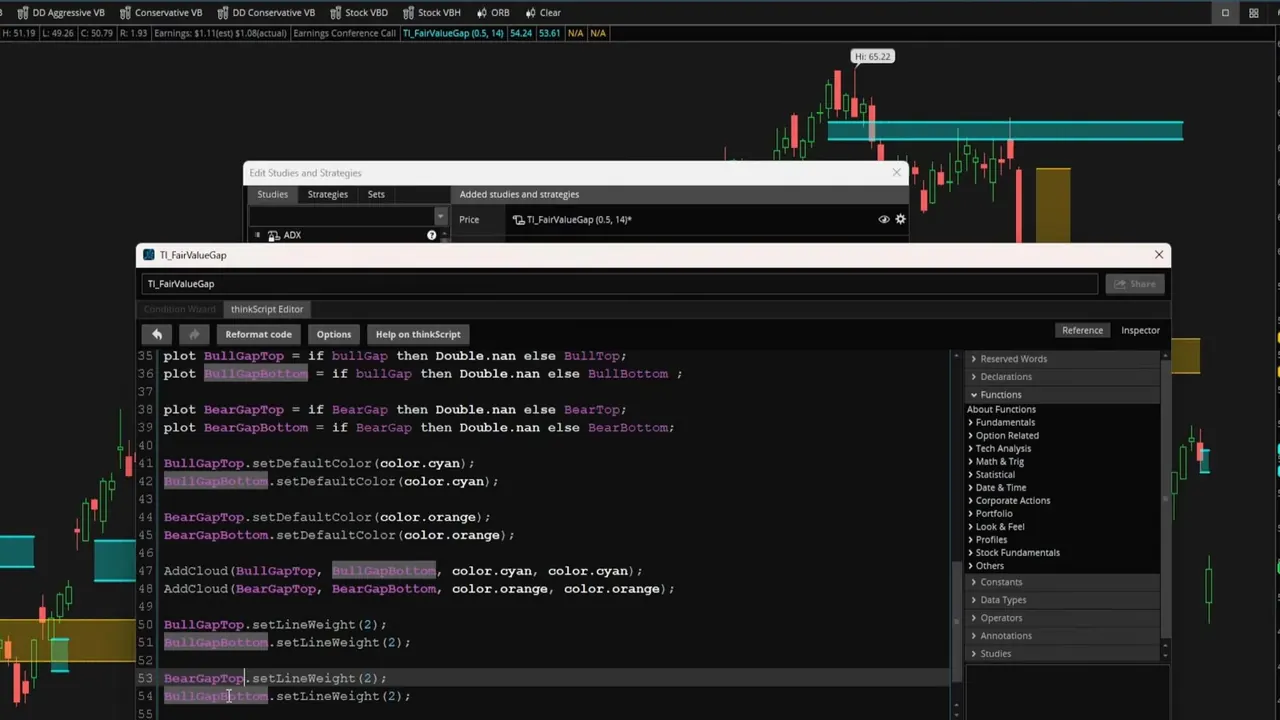
If you plot bullTop directly, you get one continuous line that connects each gap to the next. To fix that, the plot returns Double.nan on the bar where a gap forms, so each new gap starts fresh. AddCloud then shades the space between each top and bottom.
This step’s code is free with an account. Create one or sign in.
Full thinkScript code
Create a free account or sign in to copy all 68 lines and download the file.
Video: building the indicator, line by line
25 minutes in ThinkOrSwim, from an empty editor to the finished study. Each chapter opens the video at that point.
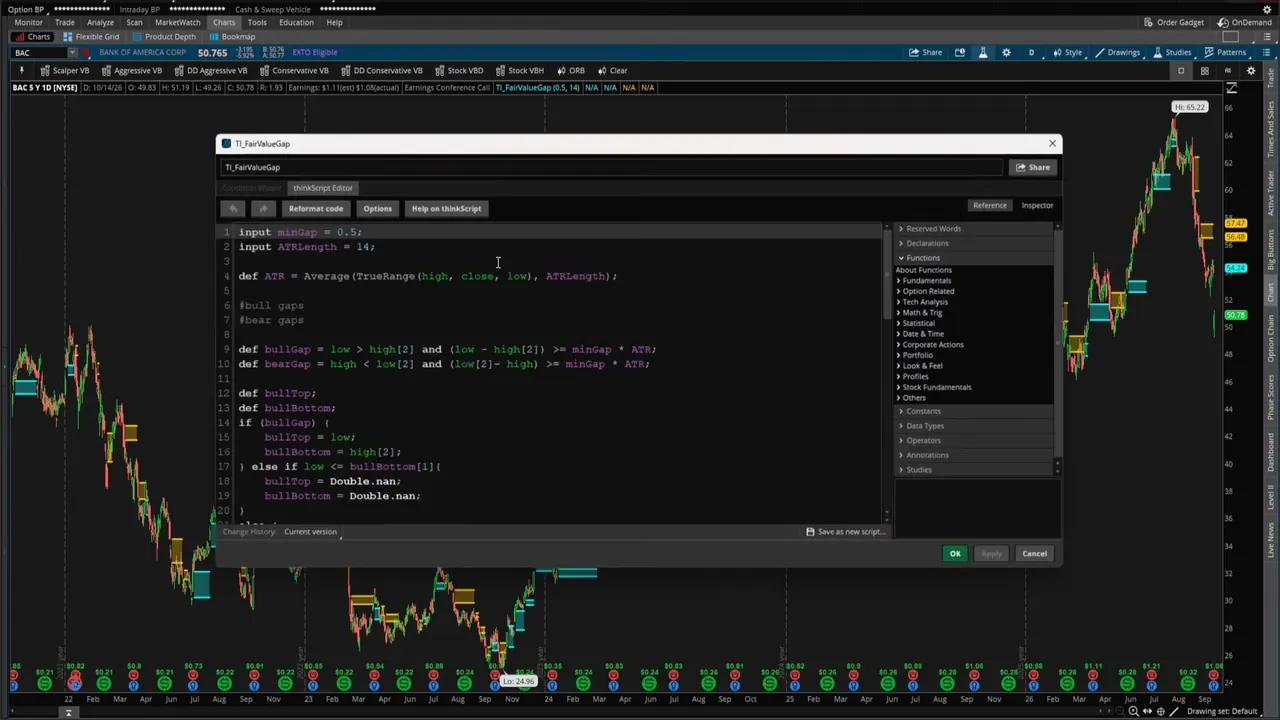 How to Build a Fair Value Gap Indicator in ThinkOrSwim · 25:30
Limitations
The code is thinkScript. There is no TradingView version.
A new bull gap replaces the previous bull gap, so older open gaps drop off the chart. Same for bear gaps.
A gap shows where price may come back to. It doesn't tell you when to act, and the study found no return edge from the retest alone.
It plots on intraday and weekly charts, but the study only covers daily bars.
To find every stock sitting in a gap, you need a scan. That's Part 2, below.
Part 2: the Fair Value Gap Retest Scan
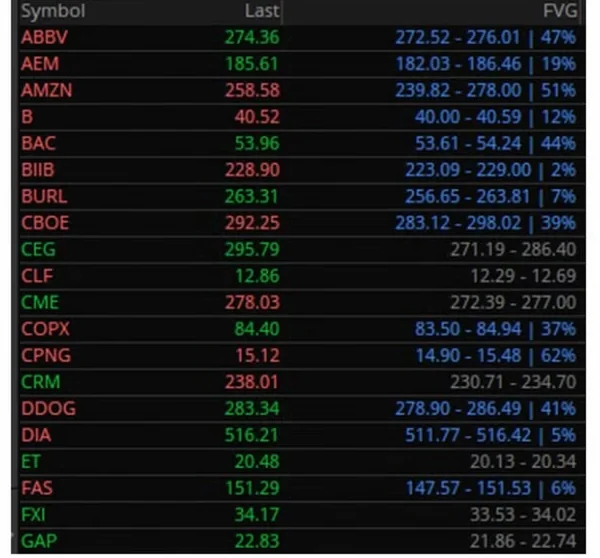
Part 2 runs the same logic across a whole watchlist. It has three pieces:
- An upgrade to this indicator that tracks how deep price has traded into each gap.
- A Stock Hacker scan that finds stocks retesting an open fair value gap today.
- A custom scan-tab column that prints each stock's gap levels, color coded, so you can rank the results.
It ends with how I pair the scan with Edge Signals to time an entry.
Questions
How do I install the Fair Value Gap indicator in ThinkOrSwim?
Copy the code from this page or the .txt download. In ThinkOrSwim, click Studies, then Create. Delete the placeholder code, paste in the fair value gap code, name the study (I used TI_FairValueGap), and click OK, then Apply.
What do the cyan and orange clouds mean?
Cyan clouds are bull gaps, where the current bar's low is above the high from 2 bars ago. Orange clouds are bear gaps, where the current bar's high is below the low from 2 bars ago. Each cloud stays on the chart until price fills it.
What does the minGap input do?
minGap sets the minimum gap width as a multiple of ATR. The default of 0.5 keeps gaps at least half of a 14-bar ATR wide. Raise it to 1 to see only the widest gaps, or drop it to 0.1 to see almost every gap.
How often do fair value gaps get filled?
Across 650 stocks and ETFs and 11 years of daily bars, half of all bull gaps were completely filled within 5 trading days, and 7 out of 10 were revisited within a week. By 20 trading days, 71.8% were filled.
Why does the indicator filter out narrow gaps?
Narrow gaps rarely hold. In the study, bull gaps under a quarter ATR held on the first retest 57.8% of the time. Gaps at least 0.5 ATR wide held 89.5% of the time.
When does a gap come off the chart?
A bull gap clears once price trades down to its bottom edge, and a bear gap clears once price trades up to its top edge. A new gap on the same side also replaces the previous one.
What timeframe should I use?
Start on daily charts, which is what the video and the study use. The indicator plots on any timeframe, and because the ATR comes from the same bars, the minGap filter scales with the chart.
Is the free version the full indicator?
Yes. All 69 lines are on this page. Part 2, for members, adds the scan, the scan-tab column, and the depth upgrade.
Related tools
 Anchored VWAP
 MTF Squeeze
 Market Pulse
 Heiken Ashi Trend
 Trend Squeeze
 Simple Breakout Tool
Get each new indicator by email
One email on Sundays with the week's new tool and its code. A free account also unlocks every .txt download.
No credit card. Unsubscribe anytime.