
AAPL Stock Hits New All Time High
In tonight’s update, we’ll take a look at trades in Apple, as AAPL stock hits new all time high, along with the index futures where we faced a good deal of volatility.
We’ve been talking about AAPL for a few of our Daily Trade Reports, including yesterday and the day before. Our game plan to trade AAPL stock to new all time highs (or options) involved the following:
- Trigger: If AAPL > $294.18 in the first 15-30 minutes of market open, then start to look at AAPL as a likely trending candidate
- Target: Our closest magnet price in AAPL stock is $300. An overlap with the $300 price and a Volatility Box edge level would be ideal.
- Stop: Previous pivot low and/or Volatility Box level overlap (see link above for example)
With today’s trading activity, AAPL stock opened well above $294.18, giving us the trigger that we were looking for:
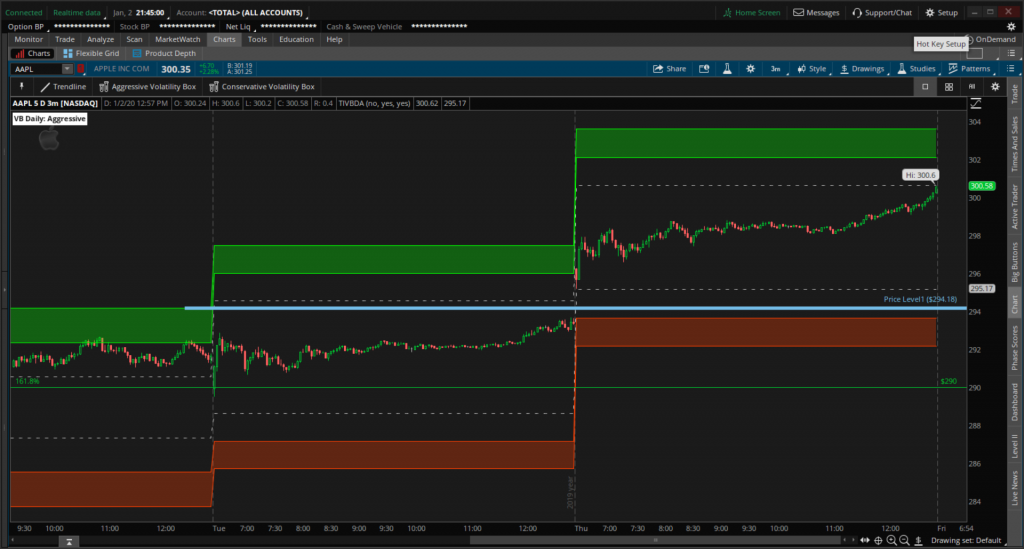
After the gap up higher, AAPL stock hits a new all time high continued to trend up into a new all time high our $300 price target, giving us a relatively stress-free trade.
For those that read the December 31, 2019 Daily Trade Report, we did a deeper dive in AAPL’s option chain that had assessed a probability of 13.91% of the $300 call option strike closing in-the-money.
For any traders still maintaining overnight scalps in AAPL stock, that is something to be wary of, as the option’s market had implied lower probabilities for a close above $300. Our weekly V-Score indicator also gives us an upper bound target in AAPL of $301.33.
Our homework in Apple paid off – we were able to use our $294.18 trigger to participate in AAPL stock hitting a new all time high.
Volatility in Futures Index Markets
Aside from AAPL, we also noticed a good deal of volatility in the S&P, DOW, Nasdaq and Russell Futures. In after hours activity, we see that the indices have plummeted across the board as a result of the U.S. strike in Baghdad, and the after-activity.
We’ll cover each market in greater detail below, and detail some of the trade opportunities. For folks looking to trade small accounts, the micro-futures, commission-free ETFs or ETF option provide a phenomenal opportunity to manage risk.
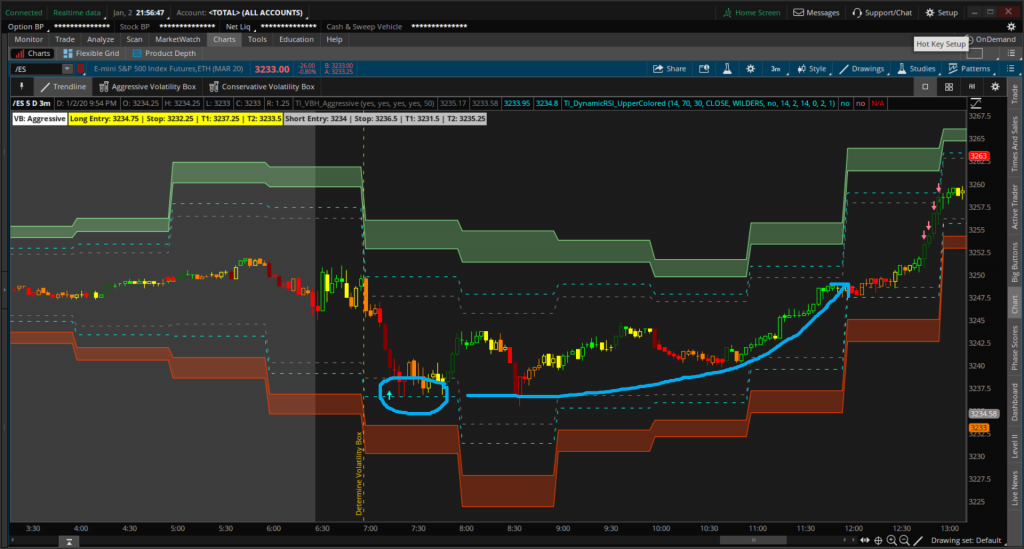
S&P 500 Futures (/ES):
The S&P gave us an opportunity to go long after the morning hour, at 3236.25. Our first target was 7 ES points away (+$350), with our second target being closer to 11.5 ES points (+$575). The S&P (along with the other indices) shot higher, giving us a max total gain of nearly 27 S&P points (+$1,350).
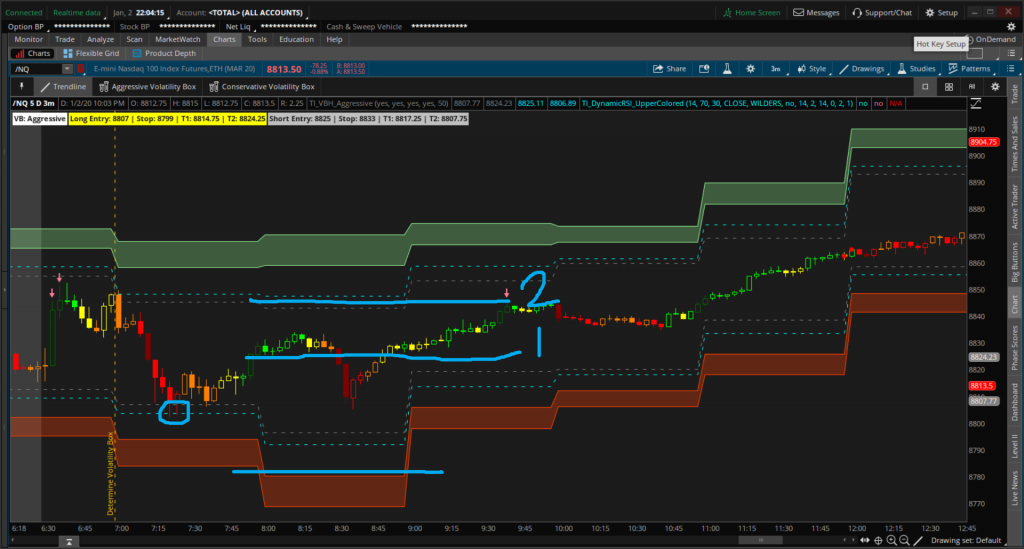
Nasdaq Futures (/NQ):
Similar to the S&P futures above, the Nasdaq futures also gave us an entry at the same time. We had an opportunity to go long the Nasdaq futures as price fell into our Volatility Box entry line giving us a beautiful risk-reward trade.
We risked ~25 NQ points ($500) to make that same 25 points with our first target, marked by the 1 in the chart below. Our second target was at the Volatility Box target line which we risked 0 points (break-even stop) for a max total gain of 42 NQ Points ($840).
Across our two contracts in the NQ futures, we were able to pull out +$1,340.
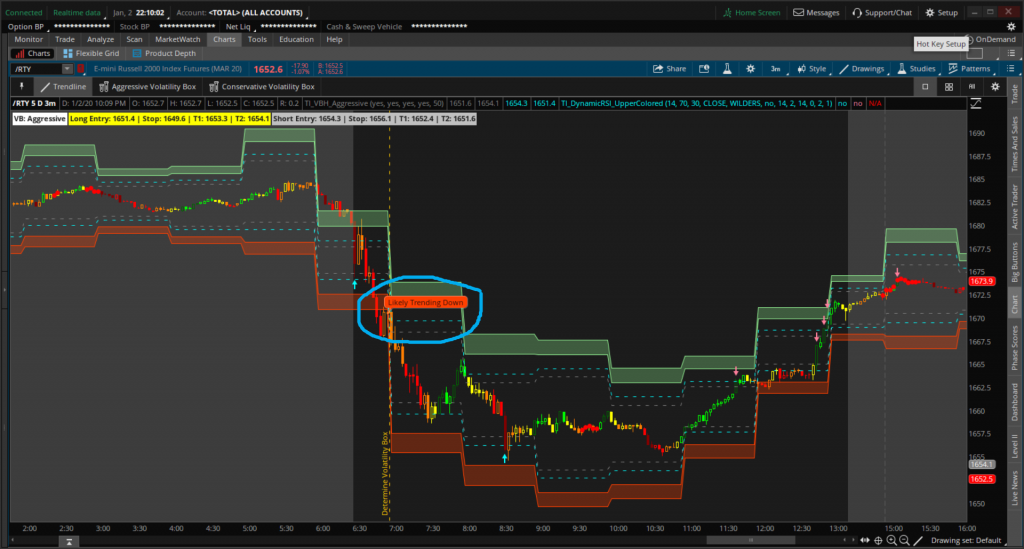
Russell 2000 Futures (/RTY):
The Russell 2000 Futures were the odd ball (as we’ve seen in past Daily Trade Videos), in that it proved to be more volatile than the remaining market.s
Within the first hour of trading, we already knew to expect greater-than-usual volatility in the RTY futures, with the breach of the Aggressive Volatility Box line. That gave us our “Likely trending down” chart bubble, after which the RTY continued to sink another ~15.6 points.
For more aggressive traders, you could have continued to use the Aggressive Volatility Box, but look at using the Triple Check Method using the Volatility Box, Dynamic RSI, and Waddah Attar Indicator to find entries using the same box.
Alternatively, our trade plan (which is more conservative) called for us to switch to the Conservative Volatility Box, which did not give us an entry in the RTY futures for the remainder of the day.
Conclusion:
In today’s Daily Trade Report update, we covered our successful trade as AAPL stock hits new all time high, which we had been discussing for the last few reports. Creating a strategic “if-this-then-that” plan, with planned triggers, stops, and targets makes the process of trading much simpler.
Our goal is to become system-driven traders, who act more like algorithms rather than creatures of emotion, which tends to derail most traders. Win or lose, we follow the probabilities associated with our trade, and it just so happened that today was a nice winning trade, in this series of trades.
This was a great trading start to 2020 – let’s see what kind of volatility appears in the markets tomorrow, with a Friday trading day, after a holiday. Add the U.S. strike (which in after hours, has taken us through multiple Volatility Boxes), and we have ourselves a nice opportunity to use our volatility trading strategies.
Happy New Year!
Start trading with an edge, at the edge, and sign up for the Volatility Box today