
 Fair Value Gap
 False Breakout Scanner
 Heiken Ashi Trend
 Stock Volatility Box
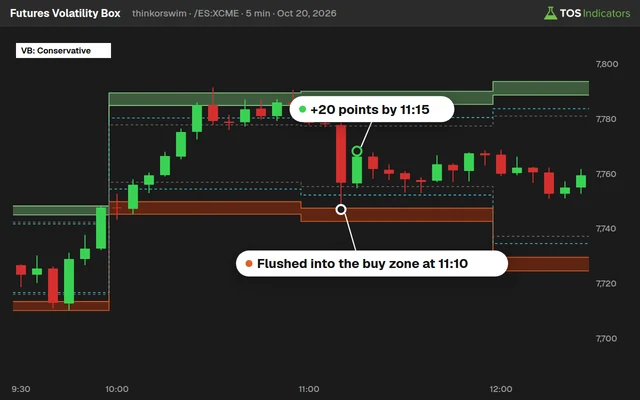 Futures Volatility Box
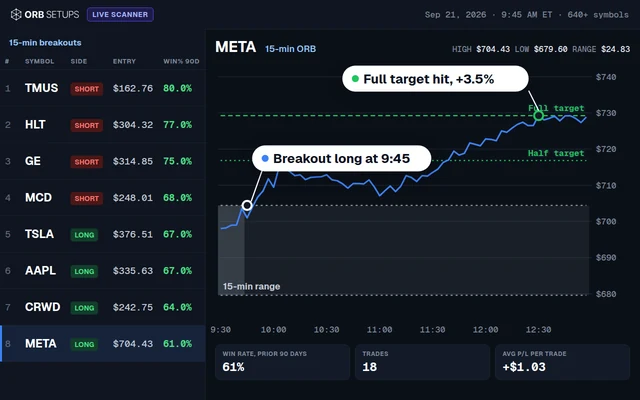 ORB Setups
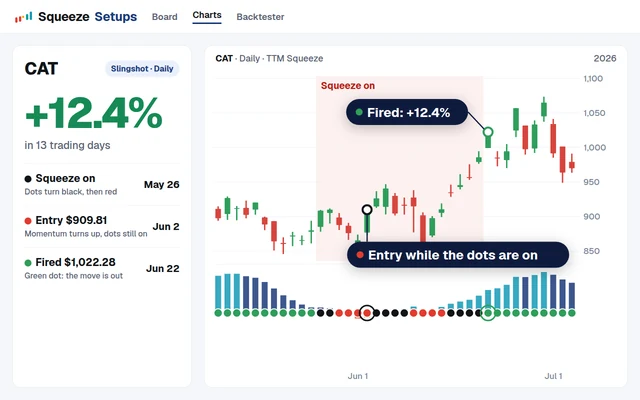 Squeeze Setups
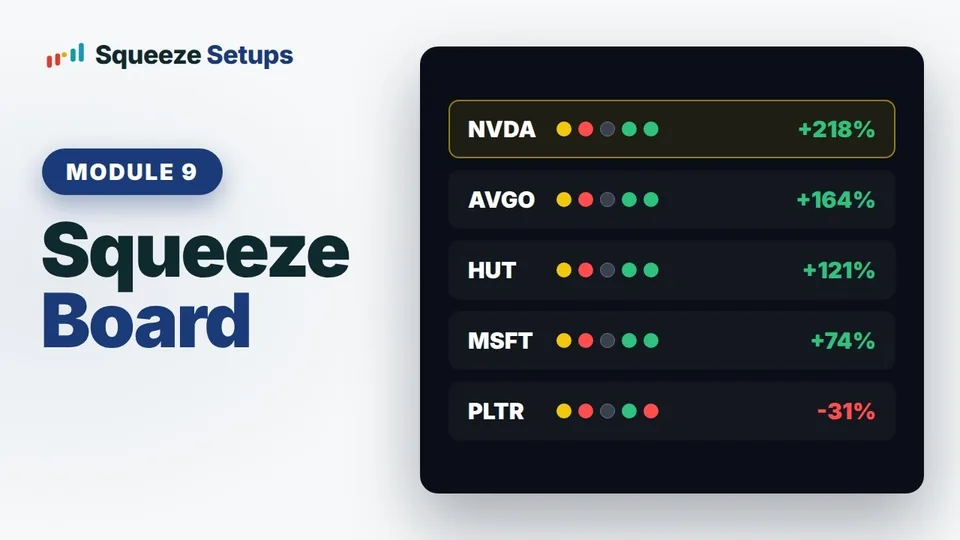
Every active squeeze across 600+ stocks and ETFs and 12 timeframes, ranked by the backtest on that name, how many timeframes are squeezing together, and the trend.
$99a month, cancel anytime
A squeeze by itself is not the edge
Compression alone did not make money in our tests. What made the difference was what came with it: a trigger while the squeeze is still on, several timeframes squeezing together, and the trend stacked up. Squeeze Setups ranks every squeeze on those three things and shows the record behind each one.
What you get
- A live Squeeze Board on 600+ stocks and ETFs
- 12 timeframes, from 5-minute to weekly
- Setups ranked by edge, confluence and trend
- The Slingshot Squeeze and Squeeze Signal
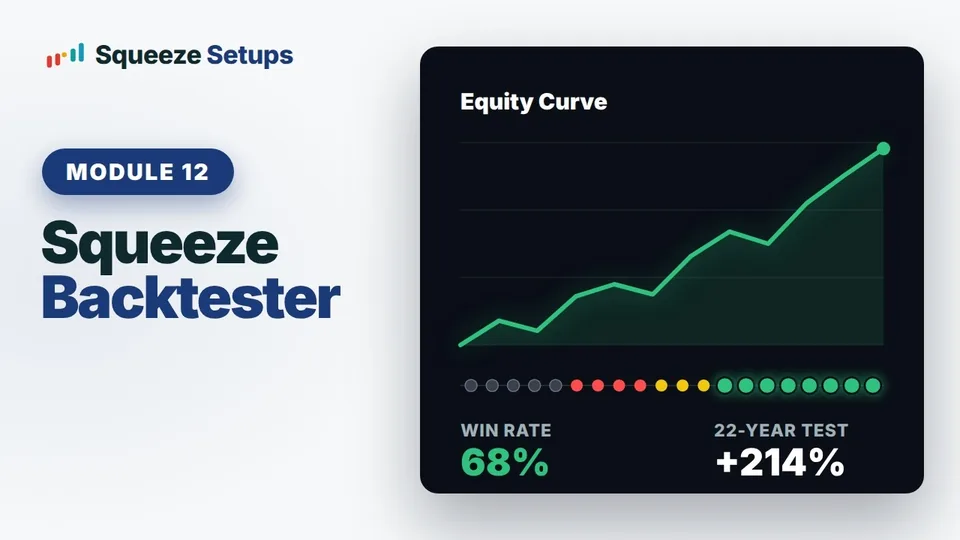
- Trade-by-trade backtests back to 2004
- The Morning Brief before the open
- Alerts when a setup triggers or fires
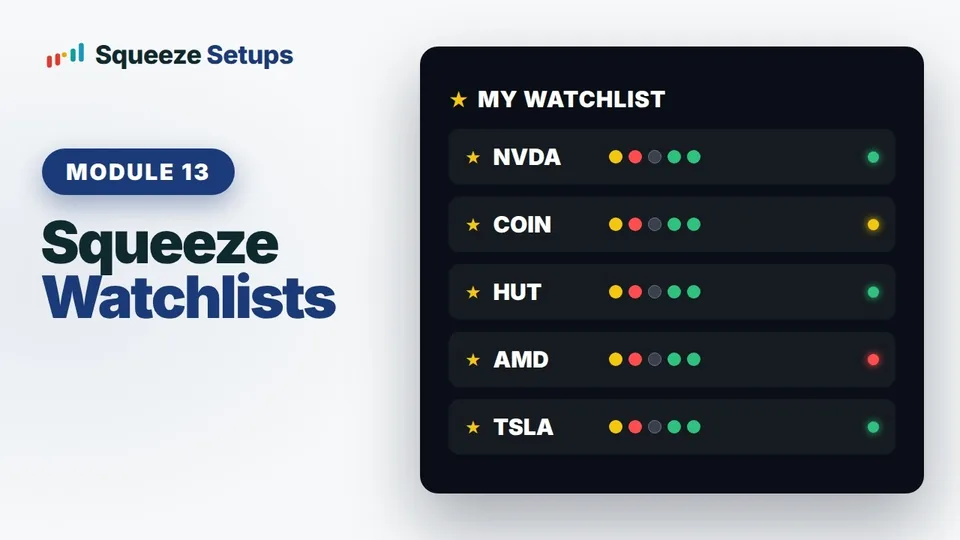
- Watchlists and a closed-trade report
How it works
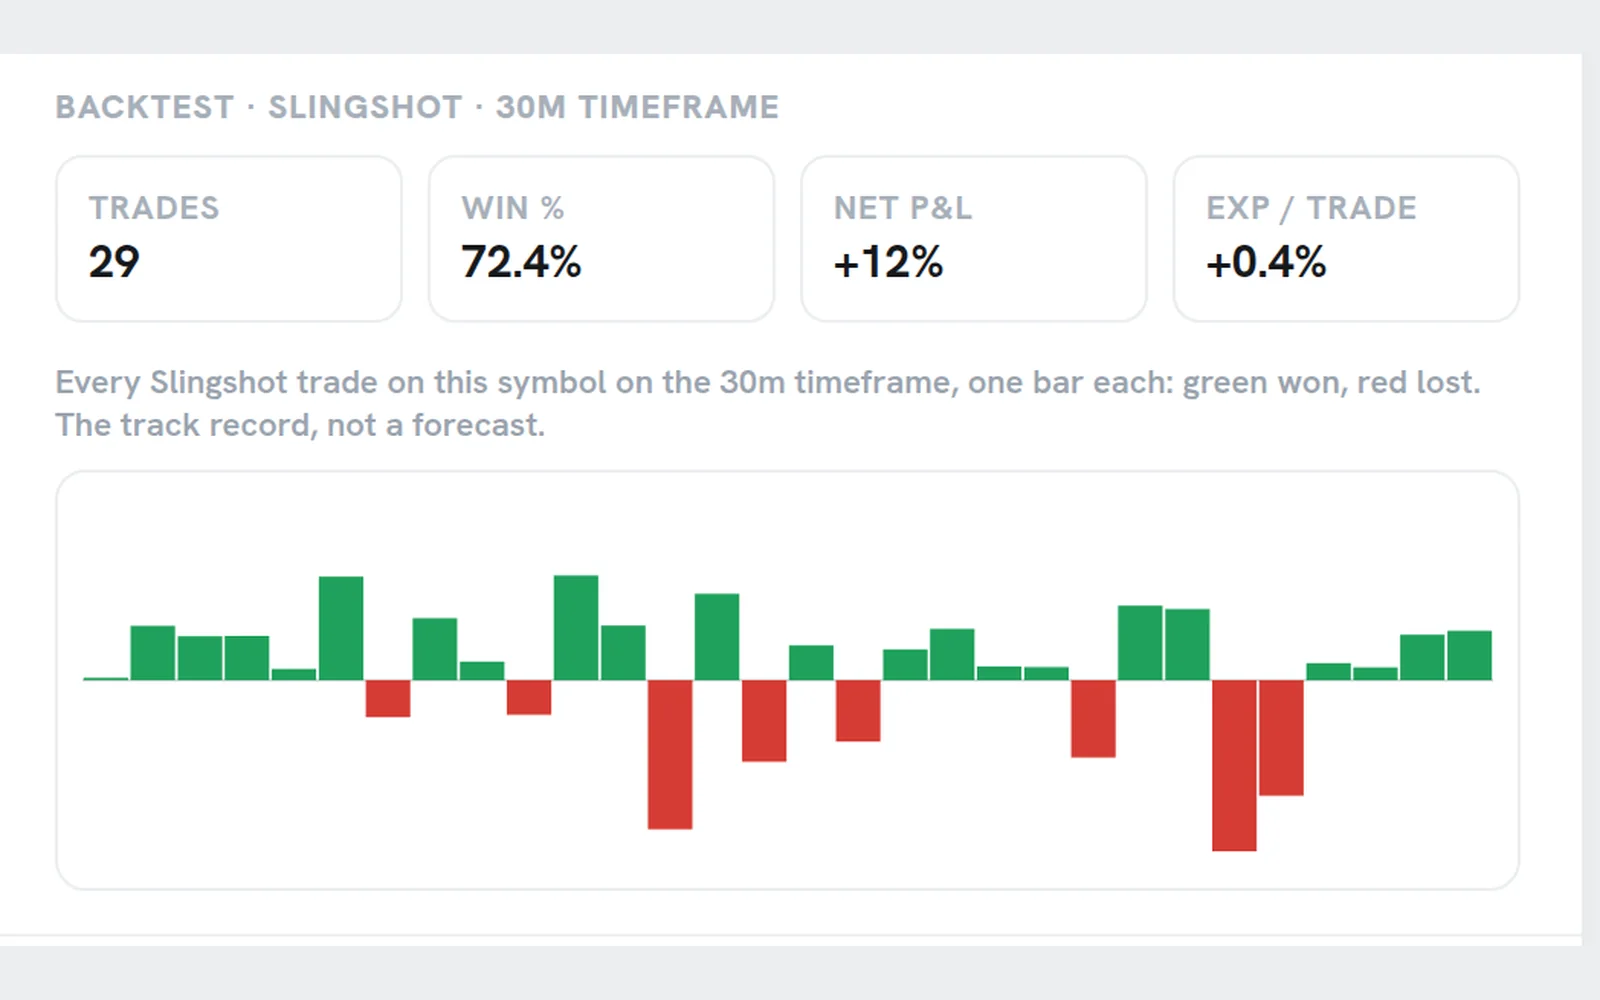
See which squeezes have paid
Every name carries its own trade-by-trade squeeze backtest, and we rank by it. The colored dot tells you a squeeze is on; the ranking tells you whether it is worth your time.
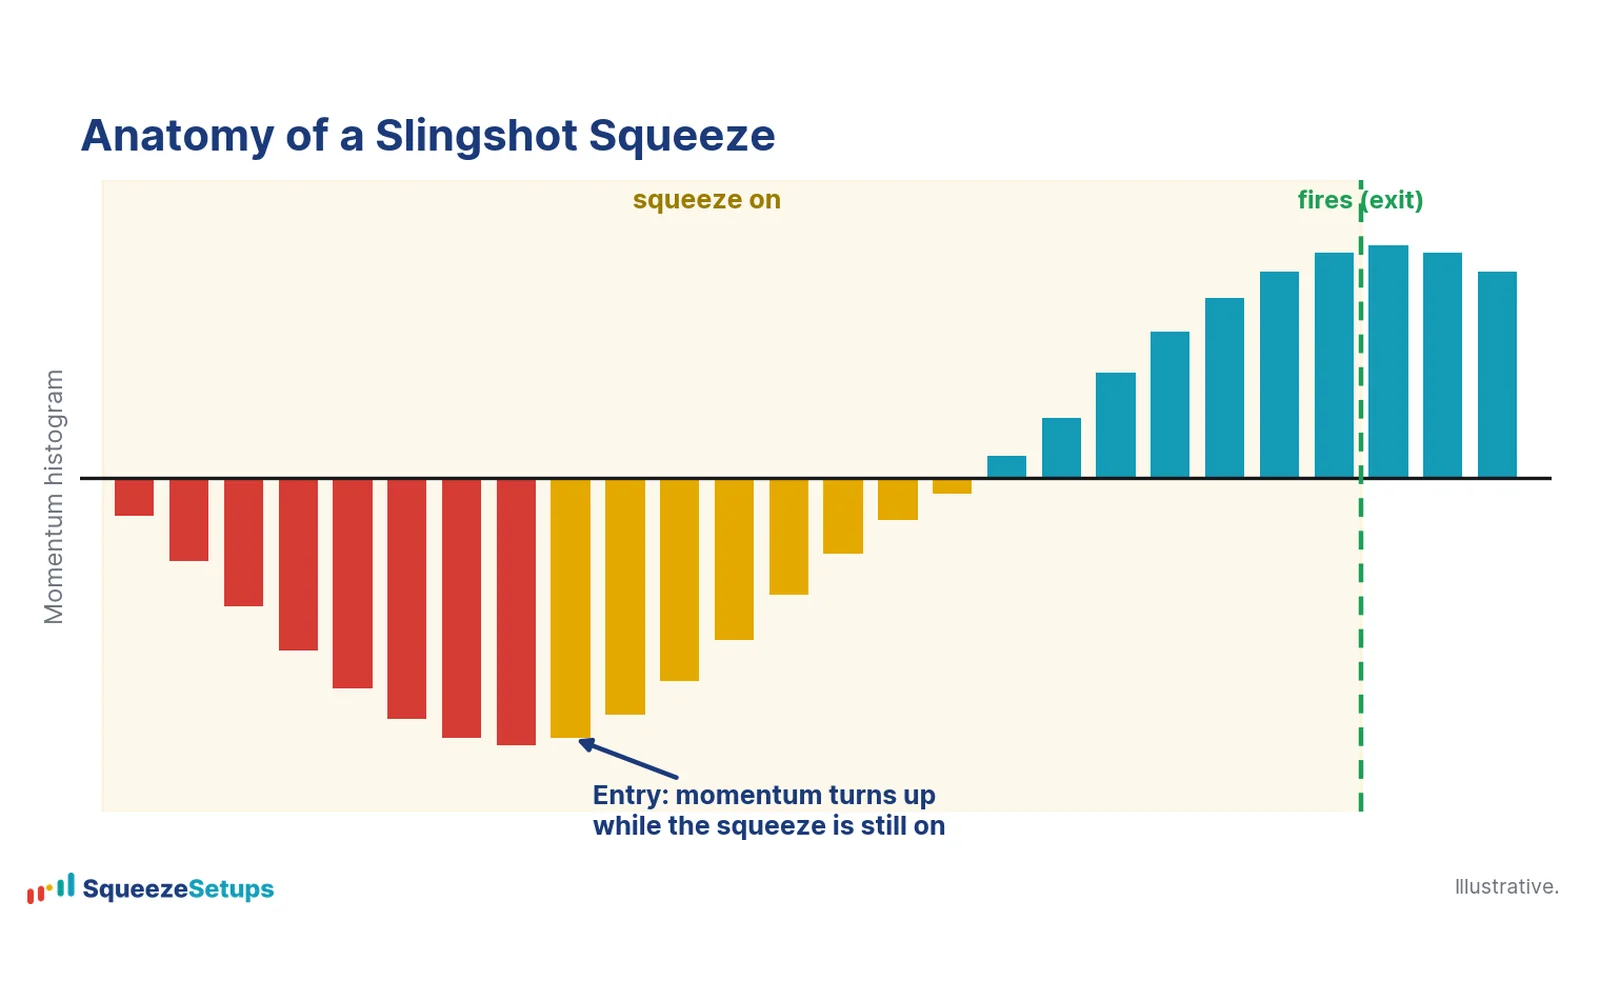
Trade the Slingshot Squeeze
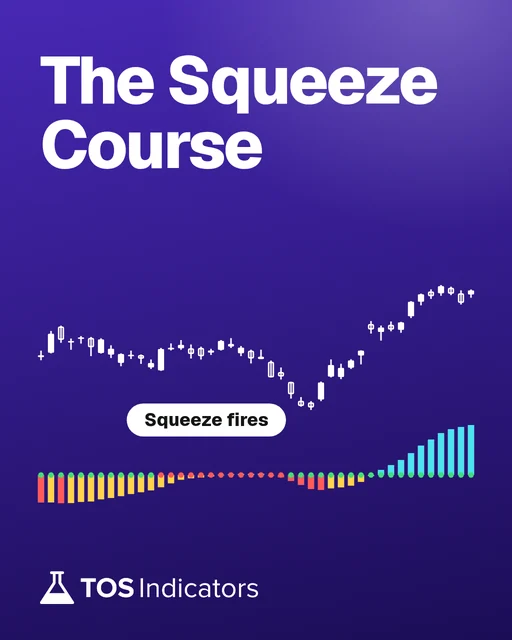
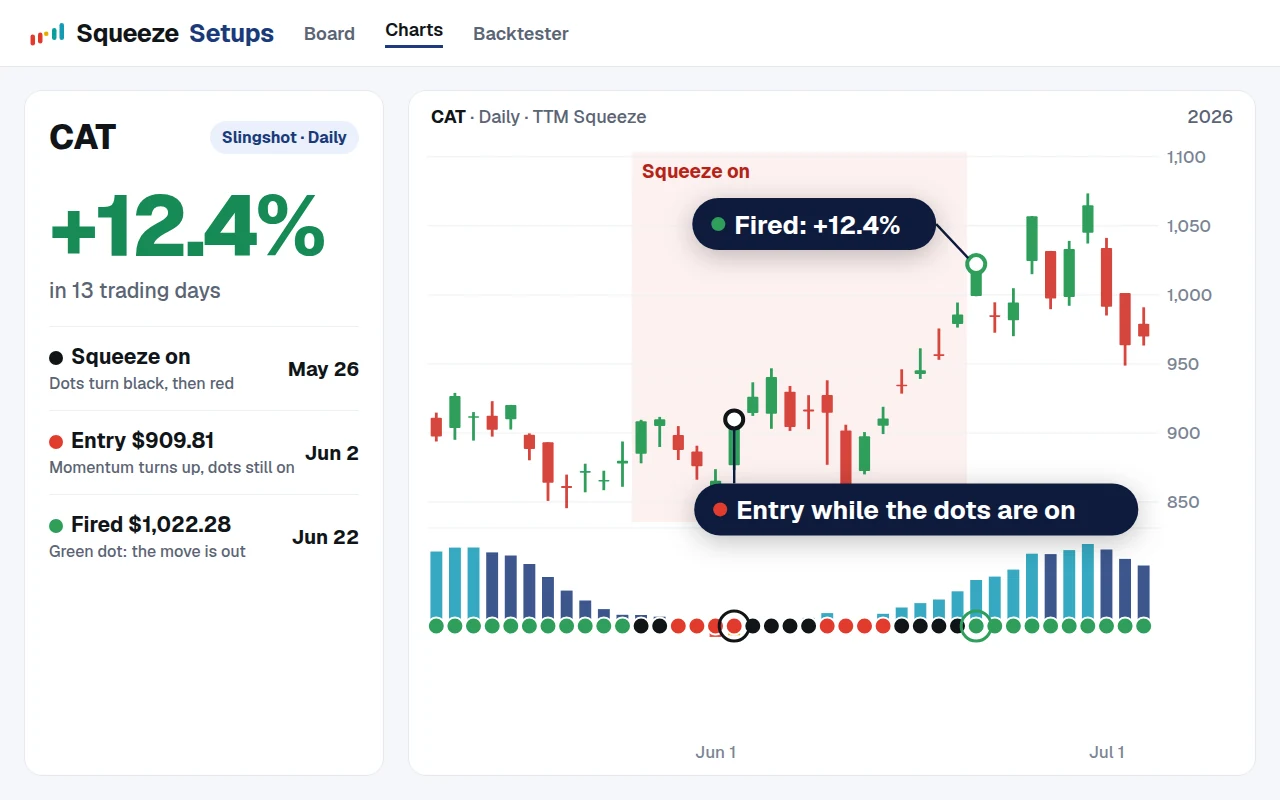
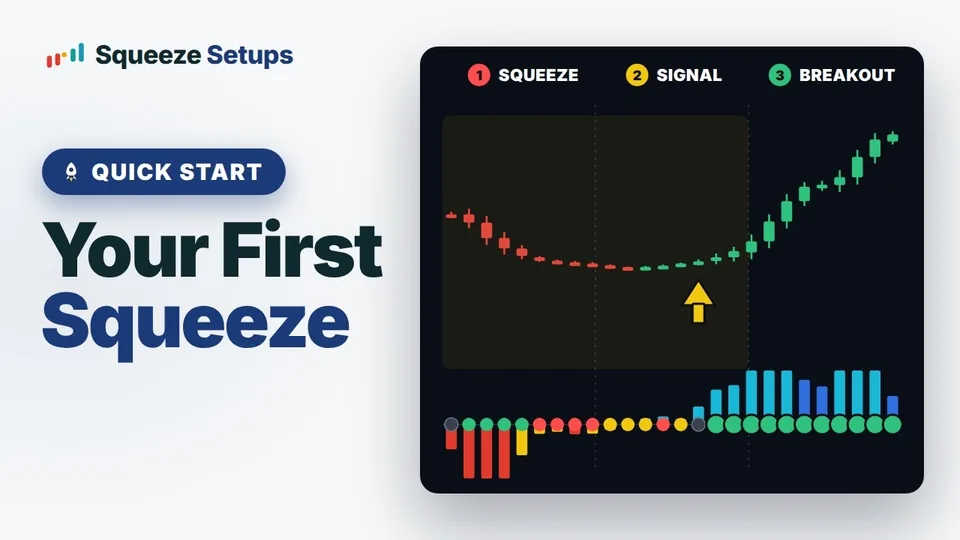
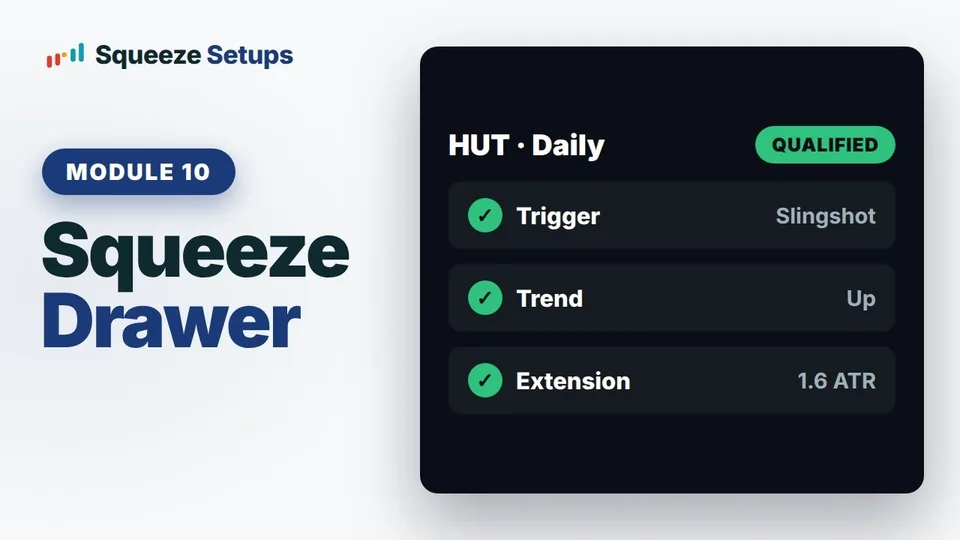
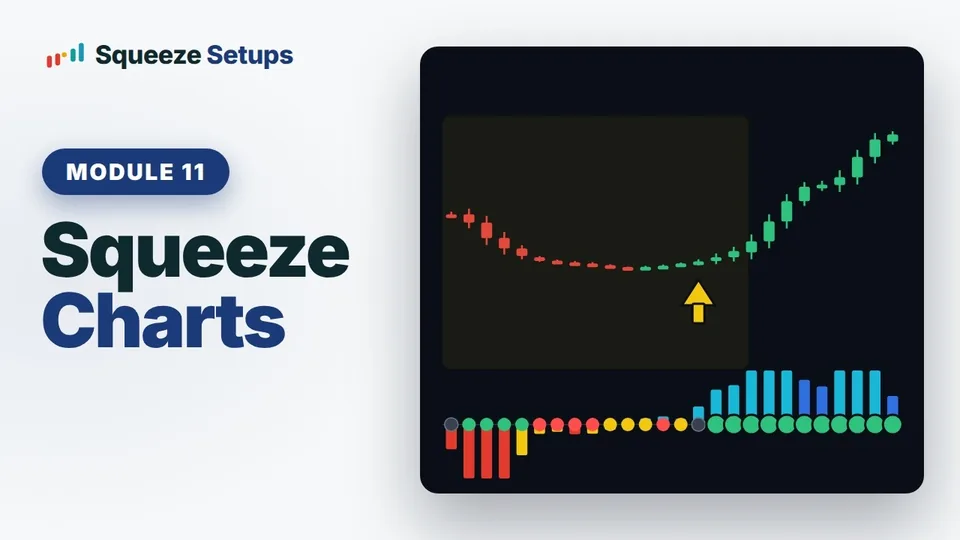
A bare squeeze is a coin flip. The Slingshot is a squeeze still on, momentum turning up from below zero, and the trend stacked behind it. You enter on the turn, while the dots are still on.
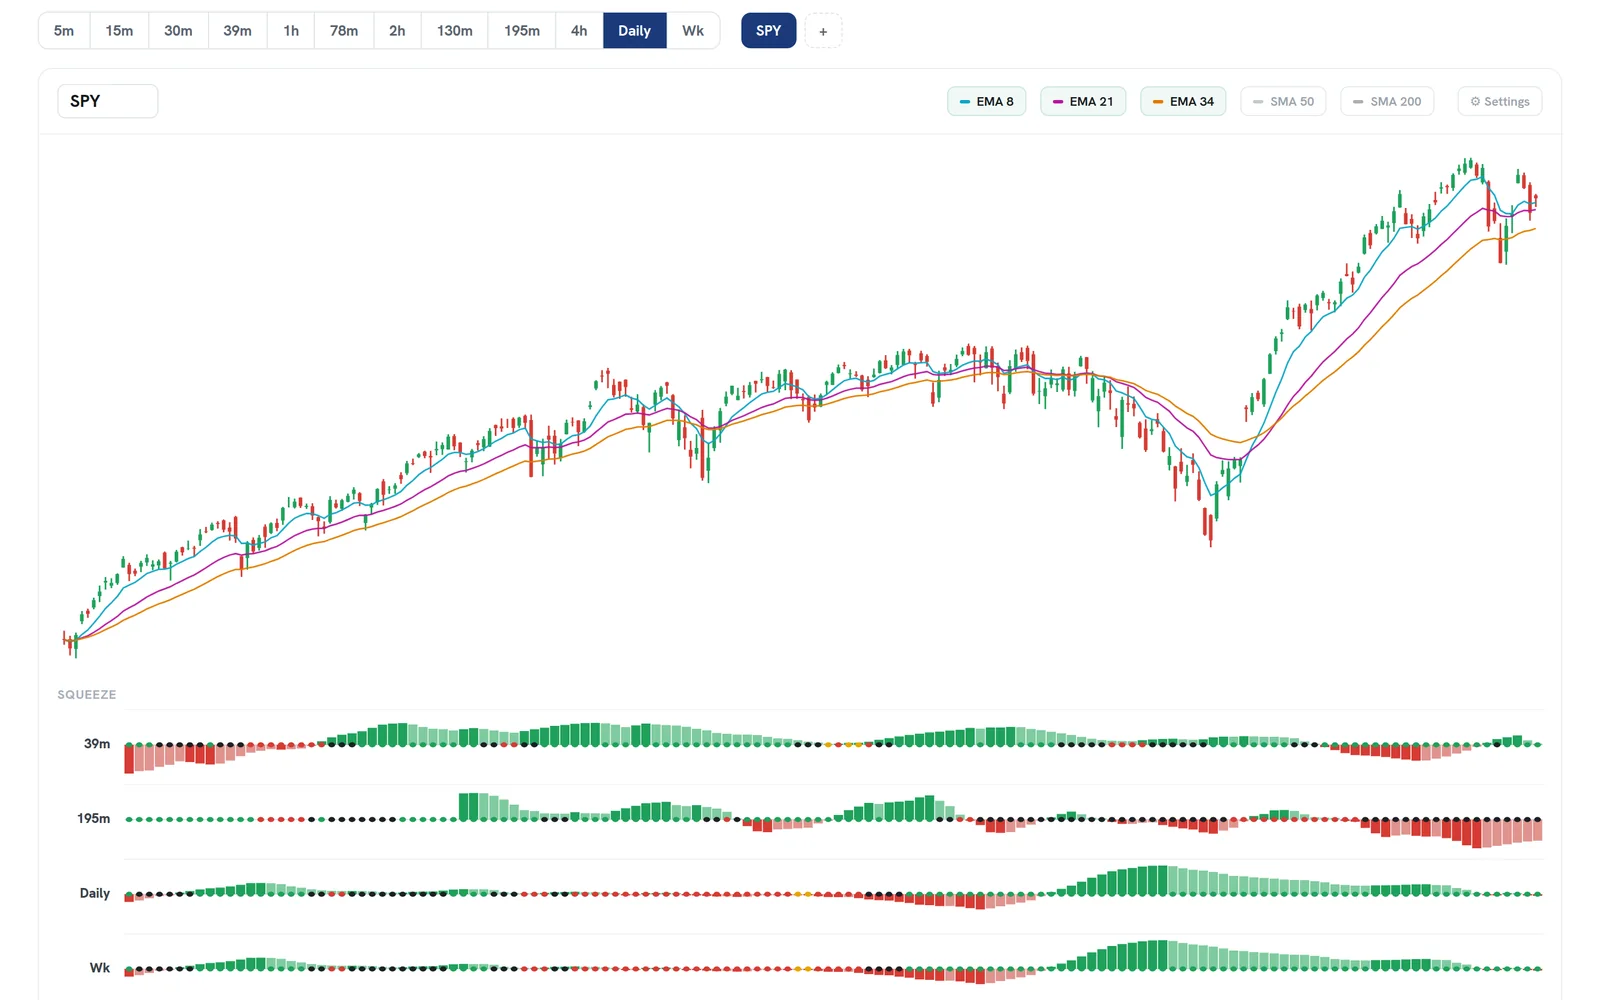
Multi-timeframe at a glance
See one name's squeeze across the 39-minute, hourly, 195-minute, daily and weekly side by side, including timeframes most charting tools cannot screen for.
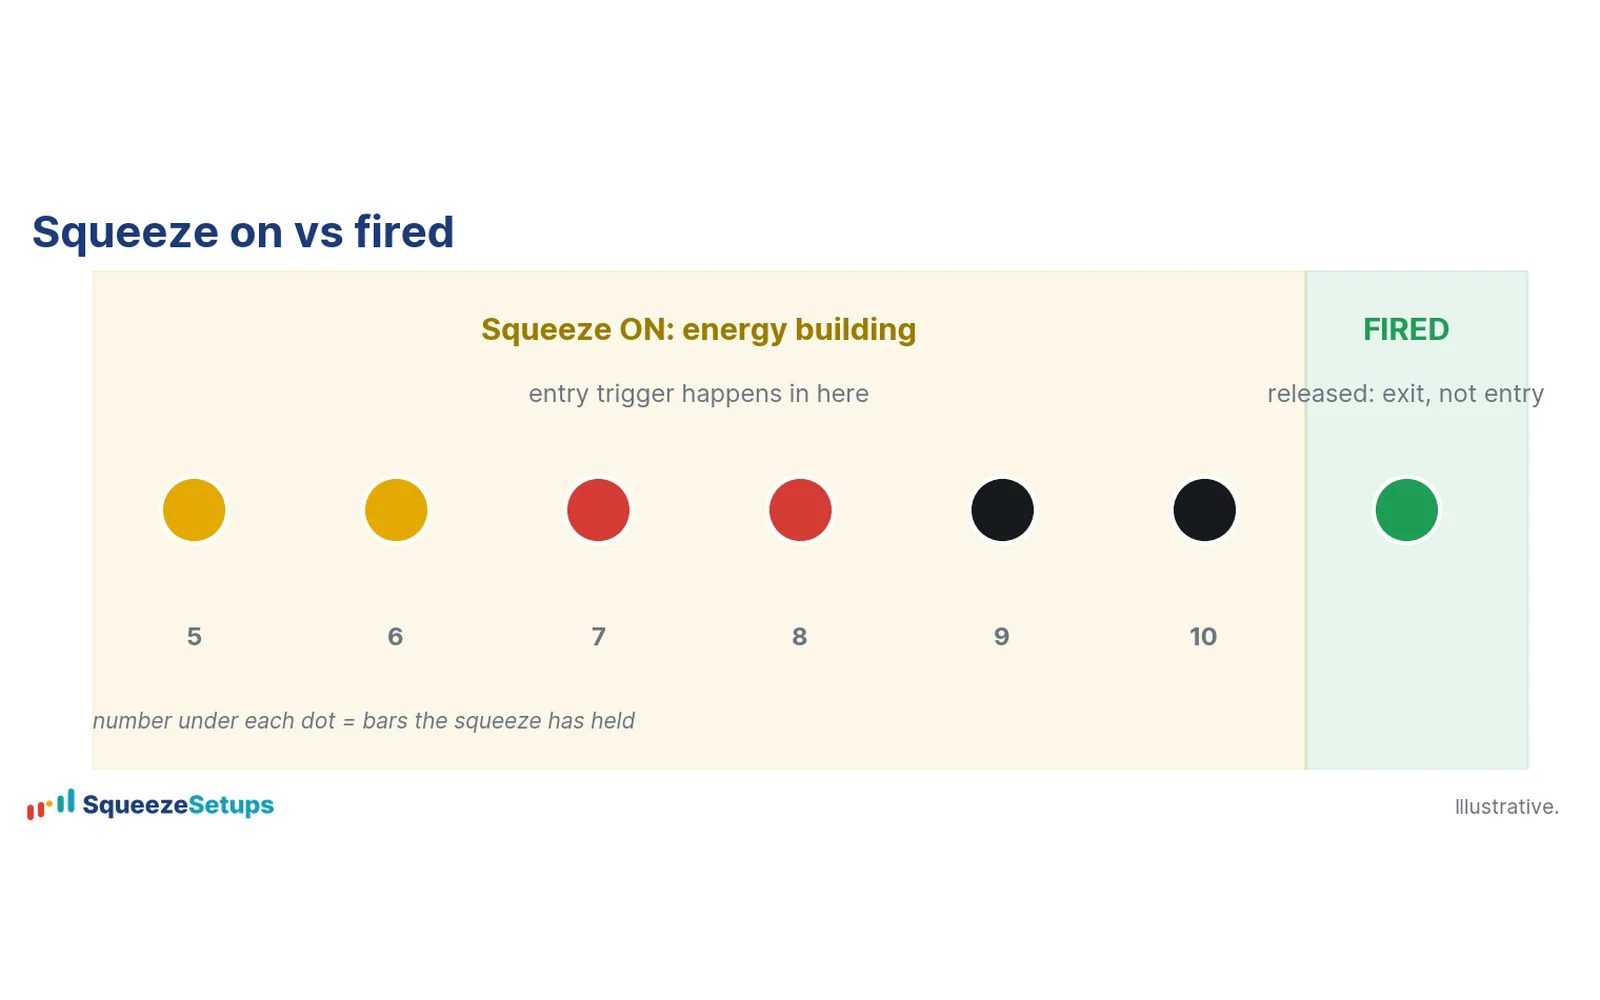
The fire is the exit
The green dots mark the release of the move. That is where you take profits, not where you enter.
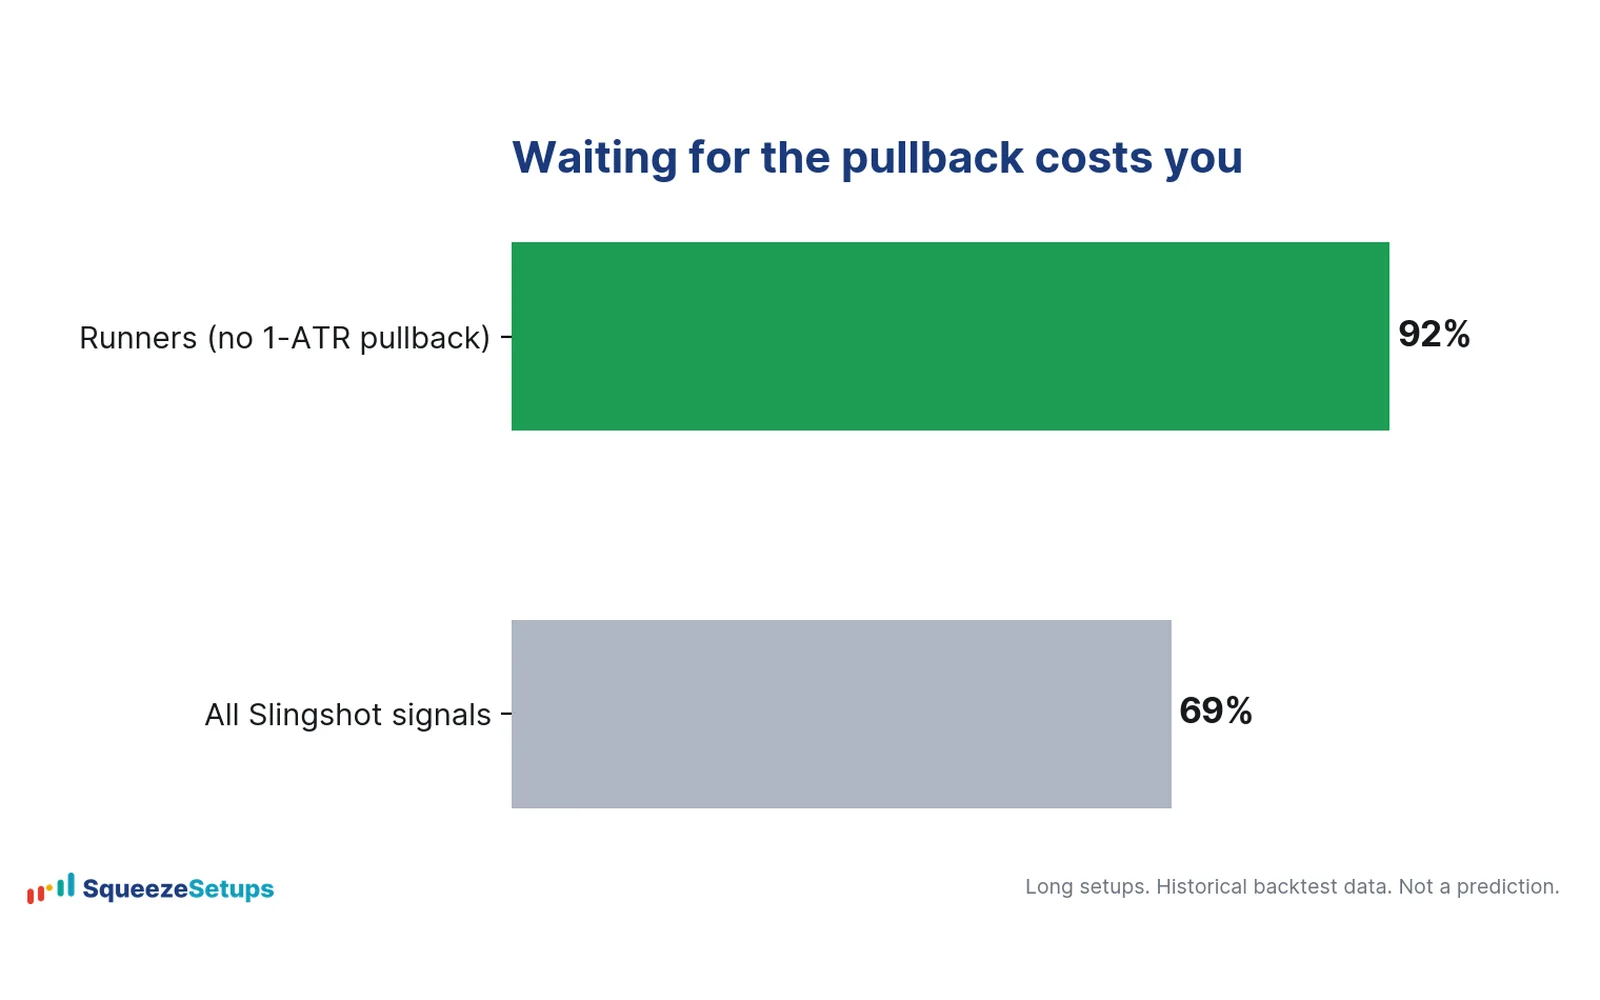
Don't wait for a pullback
Many signals never pull back even one ATR, and those runners were some of the best trades. So the playbook enters a starter on the trigger and adds on the pullback only if it comes.
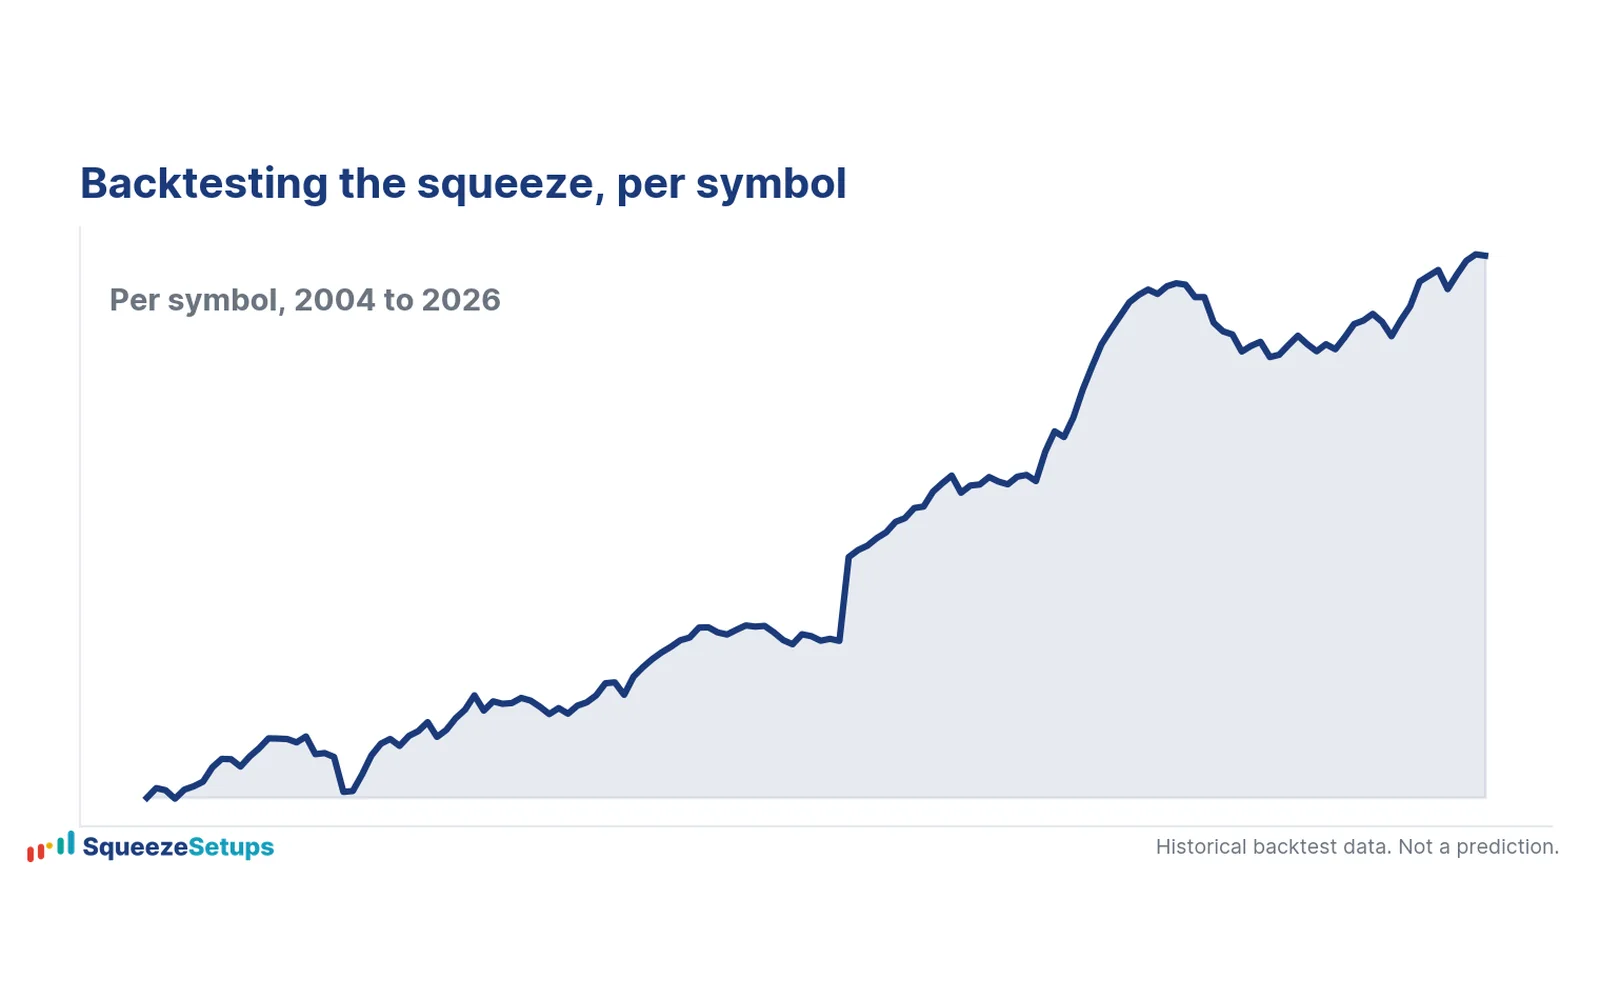
The receipts on every symbol
Open any name and see its full record, entries, exits, wins, losses and flat stretches, including the weak years. It is the evidence behind the rank, not a forecast.
The platform
Screens from the Squeeze Setups app. Backtest figures describe past trades. Results vary, and past results do not guarantee future ones.
Squeeze Board
Ranked by backtest edge, timeframe confluence and trend, with the reasons spelled out.
Backtester
Daily backtests go back to 2004 (newer listings start later), laid out trade by trade.
Morning Brief and alerts
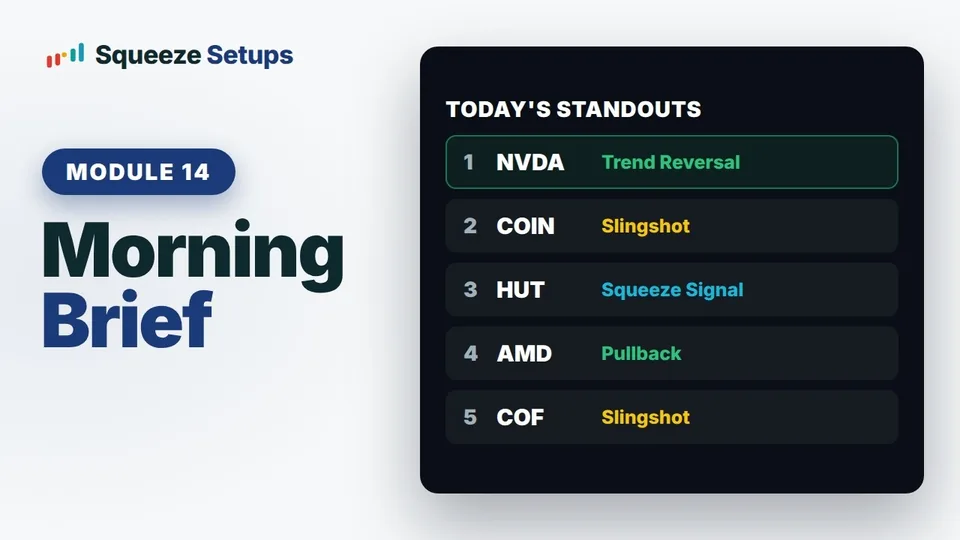
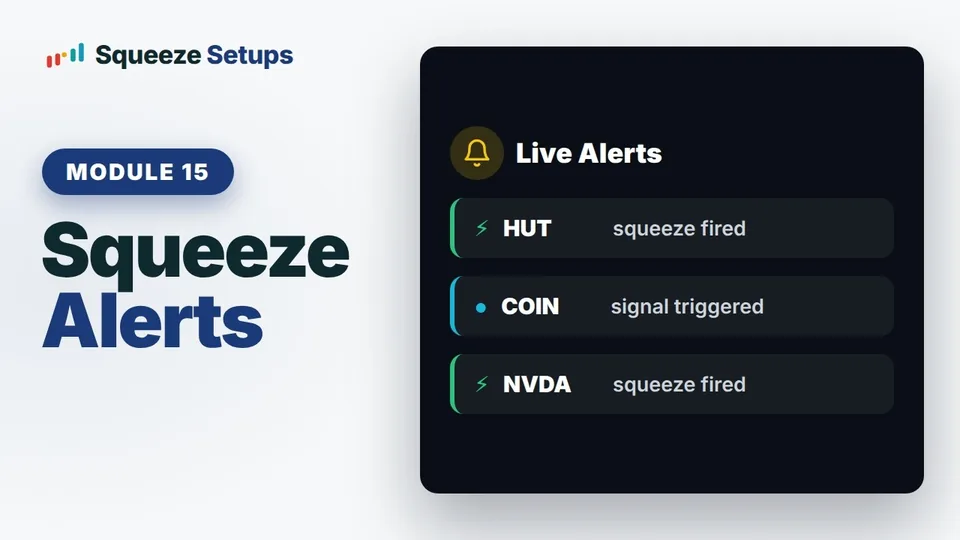
Which setups are live, which are closest to firing, and alerts when one triggers or fires, so you can act without watching all day.
Videos
Learn the platform
From the 19-part How to Trade Squeezes series, June 2026.
Squeeze Setups is in the Bundle
The Bundle adds Stock VB, Futures VB and ORB Setups, the Squeeze Course and every members-only indicator, for $253.50 a month.
Questions
What does Squeeze Setups actually do?
It finds every active squeeze across 600+ stocks and ETFs and 12 timeframes, ranks each one by the backtest on that name, how many timeframes are squeezing together, and the trend, and shows you the full record behind every symbol.
How are setups ranked?
By three things: the squeeze's own backtest on that name, how many timeframes are squeezing together, and whether the trend is stacked up. The per-symbol backtest is the edge behind the rank, not a forecast.
How far back do the backtests go?
Daily backtests start in 2004 for names that were trading then. Newer listings start when their history does.
Do I enter when the dots turn green?
No, and this matters. The entry trigger happens inside the squeeze, while compression is still on. The fire (the green dots) marks the release of the move, which is where you take profits.
What if the stock never gives me a pullback?
That happens a lot. Many signals never pull back even one ATR, which is why the playbook enters a starter on the trigger and adds on the pullback only if it comes.
Do the backtest numbers promise I will make money?
No. Every number comes from our own historical backtests and describes that sample, nothing more. Past performance does not guarantee future results, and Squeeze Setups is an educational research tool, not financial advice.
Is the Squeeze Course included?
Not with Squeeze Setups on its own. The Squeeze Course comes with Stock VB, Futures VB and the Bundle.
Can I cancel?
Yes, from your account at any time. You keep access until the period ends.
Other products
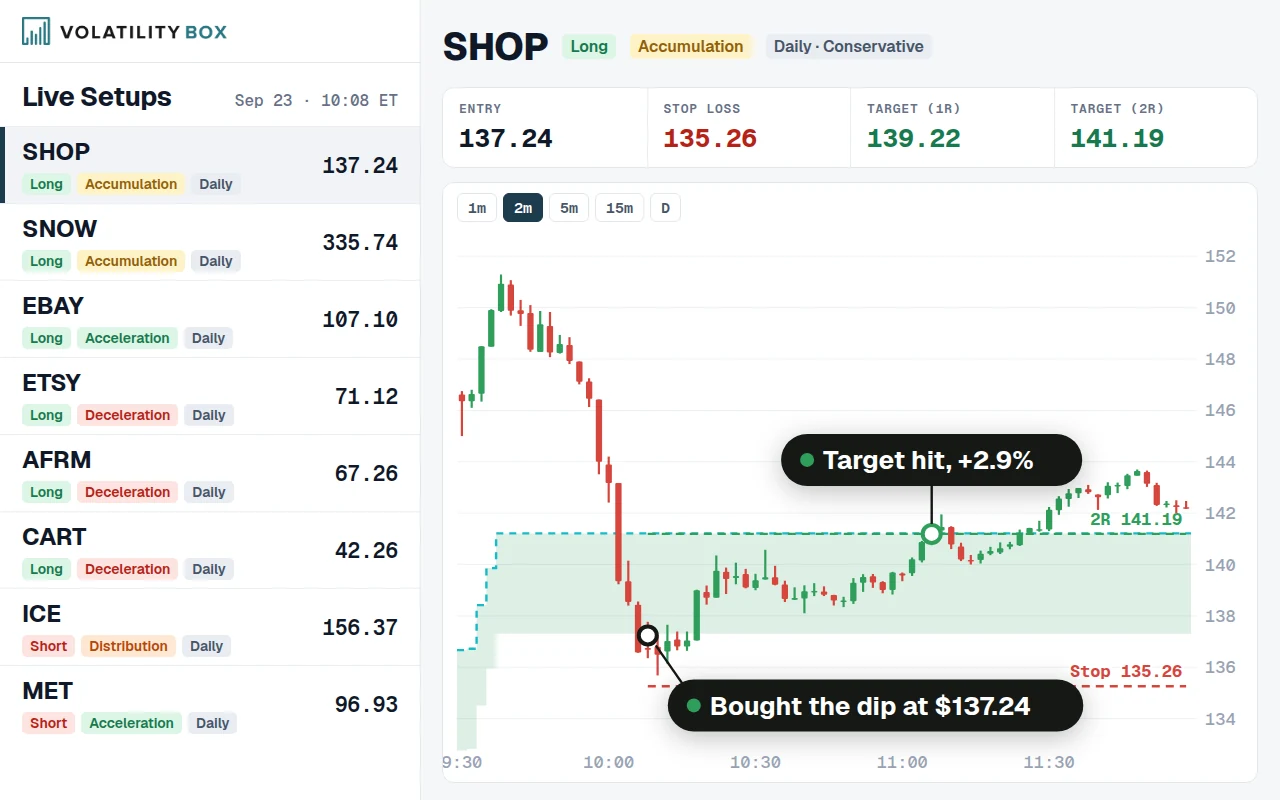 Stock Volatility Box$169 a month. Daily and hourly volatility zones for 644 stocks and ETFs, with a live scanner and a backtester.
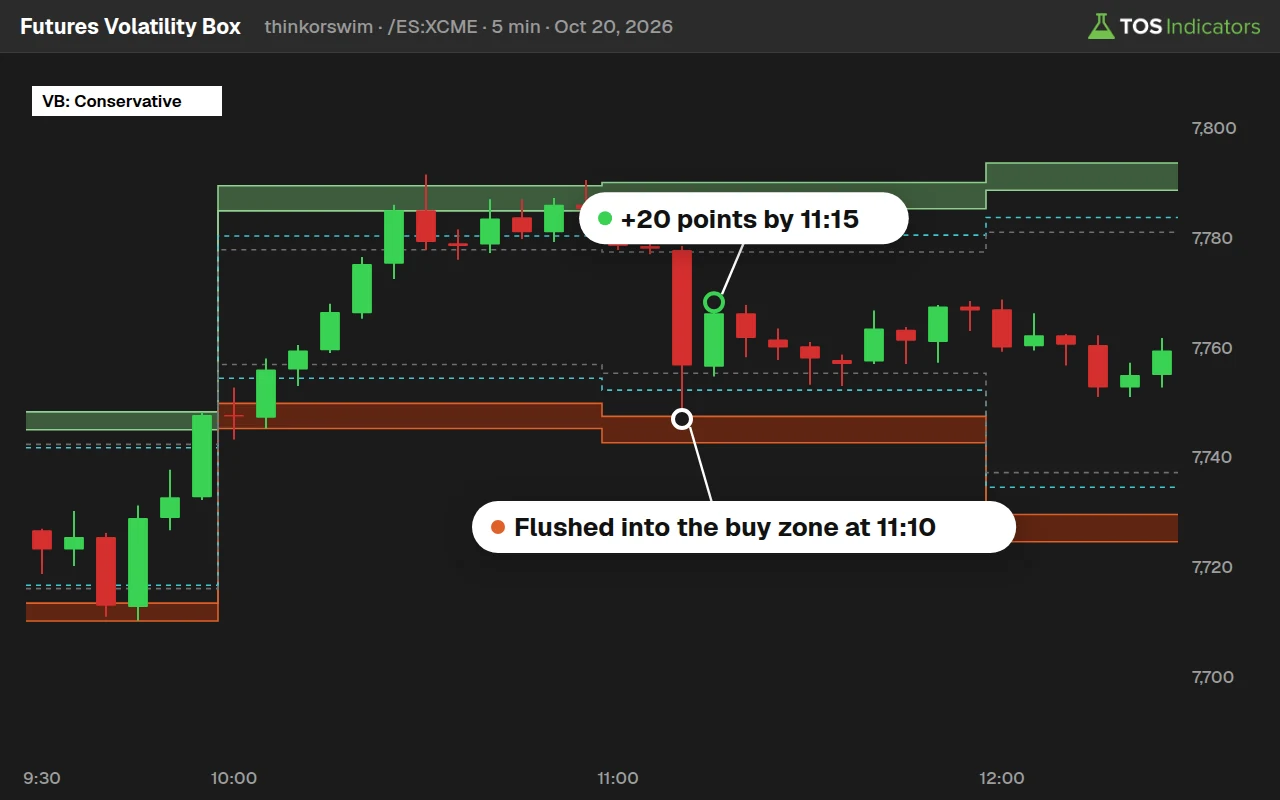 Futures Volatility Box$169 a month. 5 hourly models for 10 futures markets, the micros and SPX, for thinkorswim and TradingView.
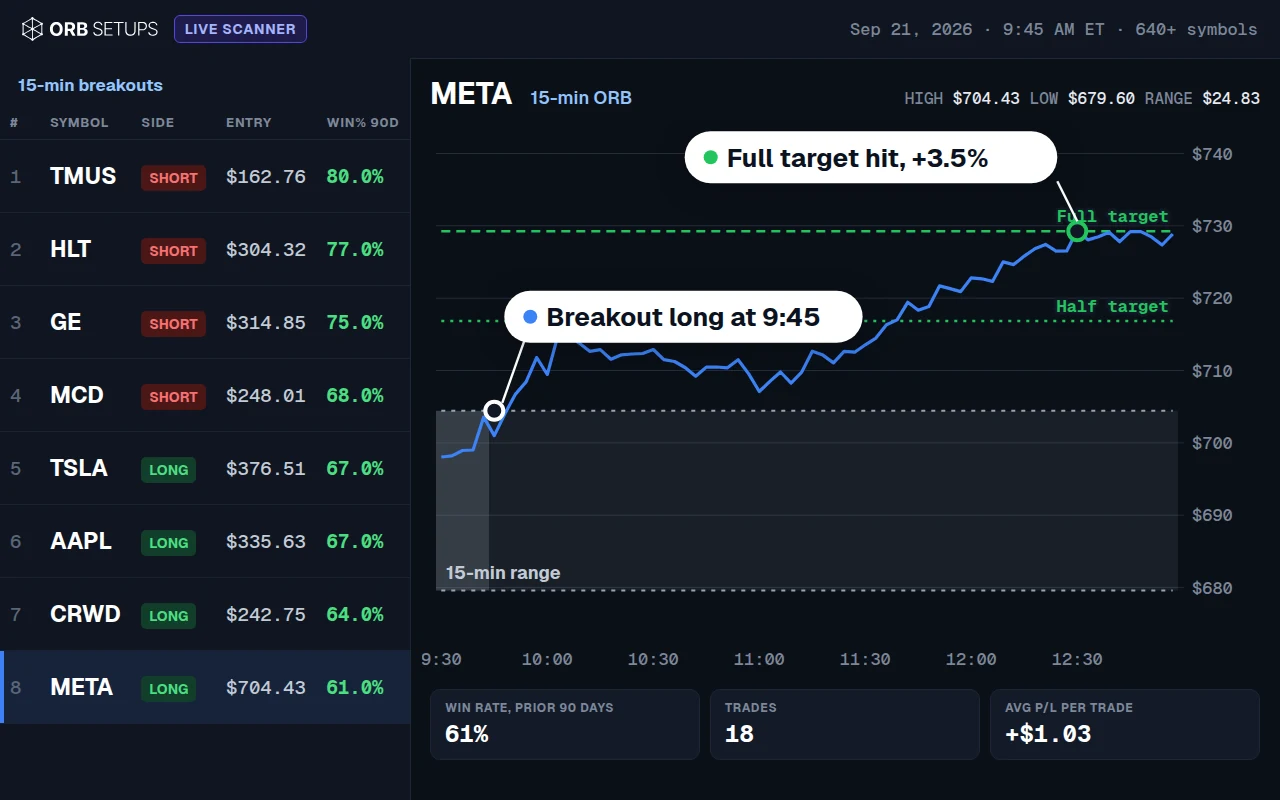 ORB Setups$99 a month. Opening range breakouts on 640+ stocks and ETFs, with each symbol's win rate and a backtester.
Get Squeeze Setups
$99 a month. Cancel anytime, no contracts, and your price stays the same as long as you stay subscribed.