
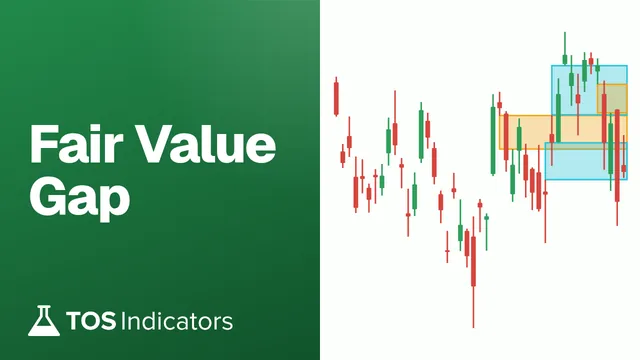
 Fair Value Gap
 Heiken Ashi Trend

 Stock Volatility Box
 Futures Volatility Box
 ORB Setups
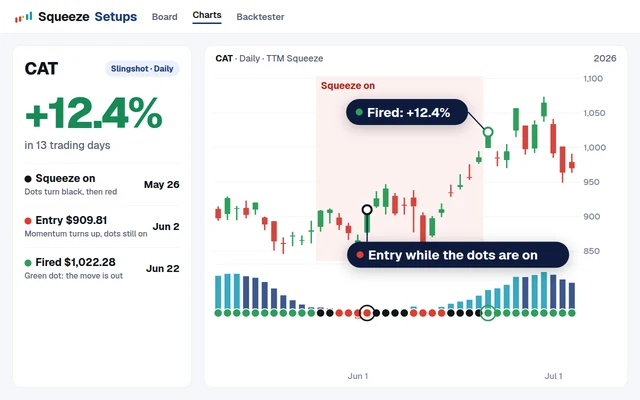 Squeeze Setups
Fair Value Gap Part 2: Retest Scan + FVG Column
Members-only Part 2: a ThinkorSwim scan that finds stocks crossing into an open fair value gap, bull and bear, plus an FVG column and a depth line.

On this page
What it does
In Part 1 we built a fair value gap indicator that draws every open gap on your chart. In this members-only Part 2, I turn it into a toolkit that finds the gaps for you: a Stock Hacker scan, bull and bear, that catches the day price crosses into an open gap, and a custom column that prints each stock's gap range and depth right in your scan tab.
We also add a dashed depth line to the Part 1 indicator, then pair the scan with Edge Signals for timing. In my study of more than 116,000 gaps, wide gaps held their first retest 89.5% of the time, and this scan is built to find that retest the day it starts.
Questions
What is in Fair Value Gap Part 2?
Part 2 is the members-only half of the fair value gap tutorial. It adds a dashed depth line to the Part 1 indicator, builds a Stock Hacker scan for fair value gap retests, bull and bear, and builds an FVG column that prints each stock's gap range and depth. The last section pairs the scan with Edge Signals for timing.
Who can access the Fair Value Gap Pro Toolkit?
Volatility Box members. Part 2 and its download are included with the stock and futures Volatility Box memberships. Part 1, where I build the fair value gap indicator from scratch, is free for everyone, with the full code on the Part 1 page.
How does the fair value gap retest scan work?
It runs on daily bars and needs 4 checks to pass. Yesterday there was an open gap, and price was still above it. Today the low crossed below the top of the gap, and it stayed above the bottom, so the gap is still open. Every check uses yesterday's gap with [1], so a brand new gap never matches itself.
What does minGapAge do in the scan?
minGapAge sets how many bars a gap must stay open before the scan counts it. The default is 2. In the video, adding it cut the bull scan from 80 results to 3, and all 3 were breaching an open gap on the chart. Raise it if you only want older gaps.
How do I scan for bearish fair value gap retests?
The download has both sides in one script. The last 2 lines are plot signal = bullSignal and a commented-out plot signal = bearSignal. Swap the comment so the bear line is live, then run it as a second scan. A scan takes exactly one plot, so keep only one of the 2 lines active.
What do the FVG column colors mean?
Cyan means price closed inside an open bull gap, and the percent is how far down into the gap it is. Orange is the same for a bear gap, measured from the bottom up. Gray means price isn't inside a gap, and the column shows the nearest open gap with below or above. Dark gray none means no open gap.
How do I add the FVG column in ThinkorSwim?
In your scan results or any watchlist, right-click a column header and click Customize. Choose Custom Quotes from the dropdown and add one, or repurpose one you no longer use. Right-click its header, choose Edit formula, paste the column code from the download, set the aggregation to D, and click OK.
How do I use Edge Signals with the fair value gap scan?
Add a second custom filter to the scan that calls TI_EdgeSignals and asks for at least 1 bullish trigger in the past 5 bars. The fair value gap scan gives you the level and the Edge Signal confirms the turn. In the video, AVO came through pulling back inside a bull gap with a recent Edge Signal.
Related
 How to Scan for False Breakouts in ThinkOrSwimScans · Beginner-Friendly
 Average True Range Scans for ThinkOrSwimScans · Beginner
 How to Build a Monthly Watchlist Scan in ThinkOrSwimScans · Beginner
 How to Build a TTM Squeeze Scan in ThinkOrSwim (5 Dots in a Row)Scans · Beginner
 Stacked Moving Average Scans for ThinkOrSwimScans · Beginner
 How to Scan for Upcoming Earnings in ThinkOrSwimScans · Beginner