
 Fair Value Gap
 False Breakout Scanner
 Heiken Ashi Trend

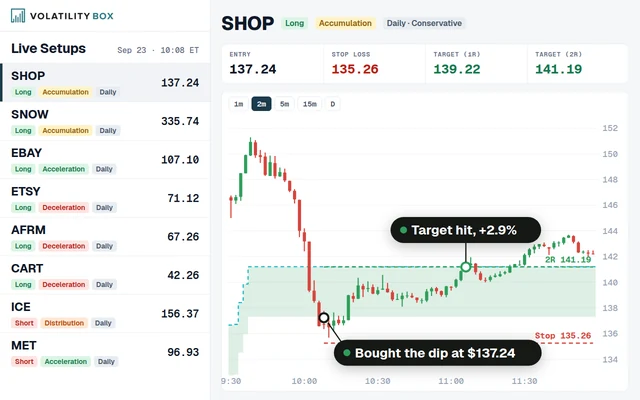 Stock Volatility Box
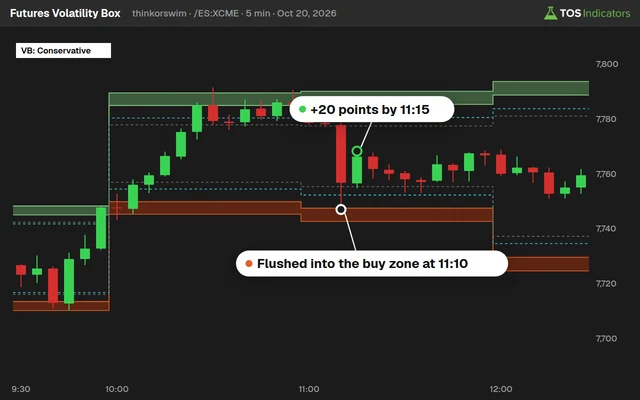 Futures Volatility Box
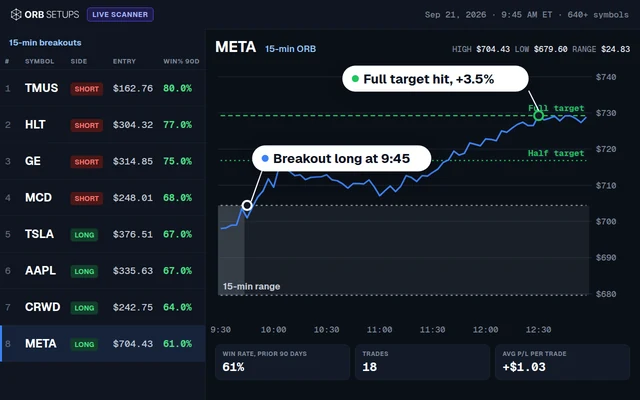 ORB Setups
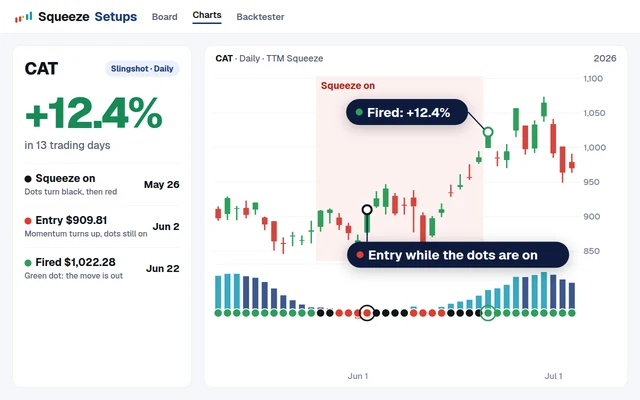 Squeeze Setups
Preparing For GS, UAL and UNH Earnings
In tonight's video, we discuss repeating patterns and tendencies in tickers that are reporting earnings tomorrow.
Over the last two years:
- Goldman Sachs (GS) - Filled its earnings gap ups 62.5% of the time
- United Air Lines (UAL) - Gap N Go in the direction 75% of the time
- United Health (UNH) - Gap N Go (Bullish) 62.5% of the time
Below are some price targets, based on if the pattern that tends to happen repeats itself, and we get a move in the direction towards our bias.
The price targets are derived using the closest standard deviation, with the V-Score indicator.
[su_table responsive="no" alternate="no" fixed="no" class=""]| Ticker | Bias | Target 1 | Target 2 |
| GS | Bearish | $ 198.68 | $ 182.99 |
| UAL | Bullish | $ 90.33 | $ 94.50 |
| UAL | Bearish | $ 82.00 | $ 77.83 |
| UNH | Bullish | $ 229.34 | $ 245.81 |
We analyze GS, UAL and UNH in deeper length in tonight's video, and also talk about things like whether these moves happen on earnings beat or misses, and the average dollar move post-earnings.
We had a total of 0 trades that set up today, for a net P/L of +$0.
Resources:
- Click here to download the Smarter Earnings indicator (FREE)
- Click here to download the V-Score indicator (FREE)
- Click here to download the Market Pulse (FREE)
- Click here to download the Simple Breakout Tool (FREE)
Sign up for a 30-day risk free trial to start trading with the Volatility Box.
 Is Apple Stock a Buy Right Now?
 Three Key Levels to Trade in NVDA for 2025
 Pay Attention to These Levels in NVDA Stock
 Instantly Reduce Risk and Increase Reward
 Nvidia Earnings Patterns After a “Beat”
 The Power of Multi-Time Frame Trends