
Volatility Box Trade Examples
Volatility models to help you trade stocks and futures like a seasoned professional
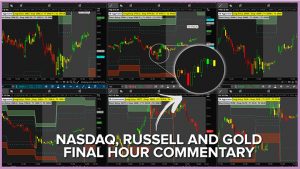
Live Market Commentary – Final Hour Russell, Nasdaq and Gold Trades
LIVE TRADING inside of the four major index futures markets and gold.
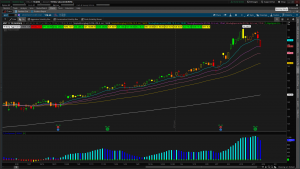
Put Call Ratio Warning for S&P 500 – February 2020
The Put-Call Ratio was screaming warning signs, one month before March 2020. Find the hidden signal here.
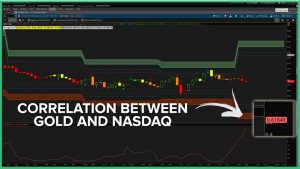
Using Gold’s Correlation Factor to Trade Nasdaq Chop
A step-by-step guide on how to use Gold’s correlation factor to trade the Nasdaq.
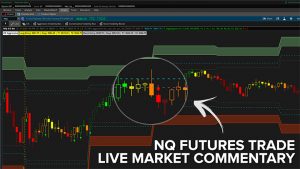
Live Market: NQ Futures Trade
LIVE TRADING: Nasdaq futures using Gold’s correlation factor as our leading indicator.
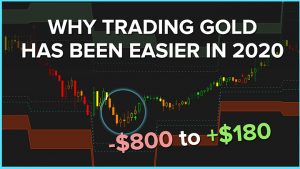
Why Gold Has Been the Better Market to Trade (from -$800 to +$180)
A side-by-side comparison between Gold and Nasdaq, using their correlation factor.
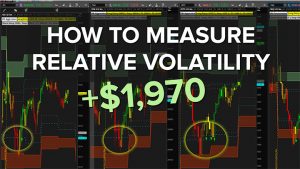
Why Understanding Relative Volatility is Critical to Futures Trading +$1,970
The secret to measuring relative volatility in the index markets, 30 minutes after the market opens.

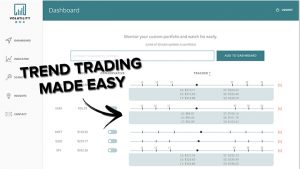
How to Quickly Identify TRENDING vs. VOLATILE Markets
A step-by-step guide to distinguish trending markets from volatile markets.
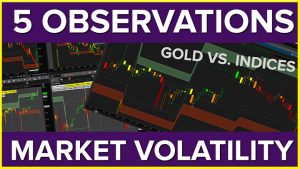
5 Observations From Recent Market Volatility
5 things that tend to repeat every single time we have volatility pick up in the markets.
How to use the Smarter Earnings ThinkOrSwim indicator?
A step-by-step guide on how to use the FREE Smarter Earnings indicator to trade earnings like a pro.
What happened in Friday’s market meltdown?
A step-by-step guide to understanding trading meltdowns on a Friday.
Case Study: Wuhan Virus Outbreak Effect on Markets
A detailed case study analysis on how the Wuhan Virus Outbreak affected the stock market’s volatility.
How to Measure Volatility In the Markets
A step-by-step guide on how to measure volatility across index markets, using one simple tool.
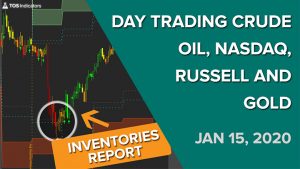
Day Trading Volatility in Nasdaq, Crude and More
Day trading setups in the Nasdaq, Crude Oil, and Russell futures markets.
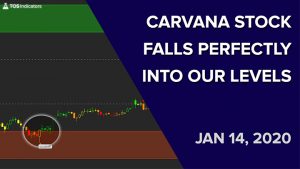
CVNA Stock Falls Perfectly Into Our Volatility Box Levels
A step-by-step walk through on CVNA stock’s volatility, and how to profit from it.
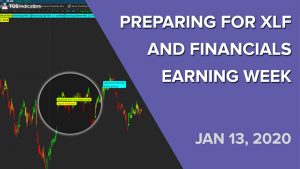
XLF Earnings This Week – Preparing and Planning
In today’s video, we’re going to continue along the theme from our previous video of our put call ratio signaling for us to be cautious. This week, XLF earnings could be the catalyst that causes the market to pullback.Last week, our put call ratio ThinkorSwim indicator (found in our Utility Labels) turned red, giving us…
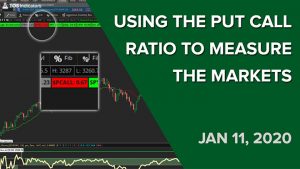
Using the ThinkOrSwim Put Call Ratio Indicator to Plan
A simple way to use the Put Call Ratio to plan your investing in a smarter, and more efficient manner.
How to Time Reversals in the Markets
Time reversals in the markets, and consistently pinpoint the best entries.
Trading TSLA to $500 and Beyond
In tonight’s video, we’ll cover trading TSLA to $500, which seemed like a distant target when we had a nice reversal trade on December 20, 2019. Outside of TSLA, WW stock which hit our trending watch list on Monday continued to rise up another 9.99%+, which was absolutely incredible. For our members that hold overnight…
Iran Rocket Attack on Al Asad Airbase Tanks Indices
In tonight’s video, we’ll take a look at how the markets reacted to Iran’s rocket attack at the Al Asad Airbase in Iraq. We’ll also take a look at a trade in WW stock from yesterday’s Daily Trade Report trending list (linked below). We did our homework, and built a list of symbols where we…

30 Year Bond Futures Lead Us to Victory
In tonight’s video, we’ll discuss how the 30 Year Bond Futures presented the most controlled volatility environment for today’s trading. While the rest of our indices gave us signals of high volatility, the 30 Year Bond Futures remained contained within the Aggressive Volatility Box. Outside of our futures’ markets, we also had entries set up…