
 Fair Value Gap
 False Breakout Scanner
 Heiken Ashi Trend
 Stock Volatility Box
 Futures Volatility Box
 ORB Setups
 Squeeze Setups
On this page
Overview
Introduction
The High Short Interest Near 52 Week Highs (thinkScript) is a powerful tool for ThinkOrSwim traders looking to gain an edge in the market.
In this comprehensive guide, you'll learn how to set up and use this dashboard effectively, understand its key features, and discover practical strategies for incorporating it into your trading workflow.
Whether you're a day trader or swing trader, this dashboard will help you make more informed trading decisions.
Understanding the High Short Interest Near 52 Week Highs (thinkScript)
This comprehensive guide covers everything you need to know about using the High Short Interest Near 52 Week Highs (thinkScript) in ThinkOrSwim.
Full thinkScript code
Create a free account or sign in to copy all 22 lines and download the file.
Download
Download the High Short Interest Near 52 Week Highs (thinkScript) Indicator for ThinkOrSwim. The download contains a STUDY.ts file, which you can directly import into your ThinkOrSwim platform.
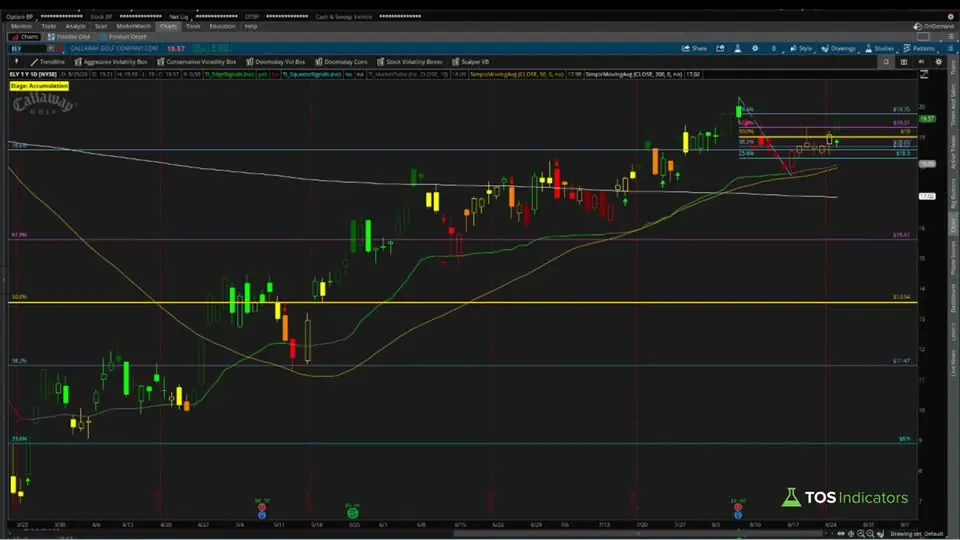
Video: High Short Interest Near 52 Week Highs, built line by line
10 minutes on YouTube.
 Watch on YouTube
Questions
How to use High Short Interest Near 52 Week Highs (thinkScript) indicator in ThinkOrSwim?
Import the High Short Interest Near 52 Week Highs (thinkScript) indicator through Studies > Edit Studies > Import. Once loaded, the indicator automatically analyzes price action and generates signals. Key settings include period length, signal sensitivity, and display options. Most traders find the default settings work well, but you can customize based on your timeframe and trading style.
What are the best settings for High Short Interest Near 52 Week Highs (thinkScript) indicator?
The optimal High Short Interest Near 52 Week Highs (thinkScript) settings depend on your trading timeframe. Start with default settings and adjust based on backtesting results. Key parameters to optimize include lookback period, signal threshold, and confirmation requirements.
Does High Short Interest Near 52 Week Highs (thinkScript) indicator repaint in ThinkOrSwim?
The High Short Interest Near 52 Week Highs (thinkScript) indicator is designed to not repaint once a candle closes. All calculations are based on confirmed price data, ensuring signals remain consistent for backtesting and live trading. However, always verify this behavior in OnDemand mode before using real capital.
Can I use High Short Interest Near 52 Week Highs (thinkScript) indicator for day trading?
Yes, the High Short Interest Near 52 Week Highs (thinkScript) works well for day trading when properly configured. Use it on 5-15 minute charts with tighter settings for more responsive signals. Combine with volume analysis and support/resistance levels for higher probability setups. Always use stop losses as intraday moves can be volatile.
How to backtest High Short Interest Near 52 Week Highs (thinkScript) indicator in ThinkOrSwim?
Use ThinkOrSwim's OnDemand feature to backtest the High Short Interest Near 52 Week Highs (thinkScript) indicator. Load historical data, apply the indicator, and manually track signals and outcomes. For automated backtesting, combine with ThinkOrSwim's strategy functions. Document win rates, average gains/losses, and optimal market conditions for best results.
Related tools
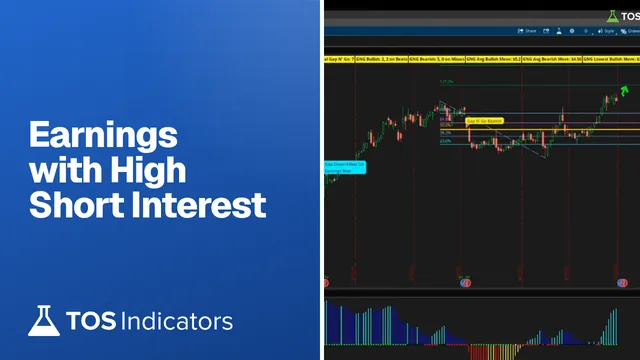 Upcoming Earnings with High Short InterestScan · Free
 30m, Daily and Weekly Squeezes with High Short InterestthinkScript tutorial · Free
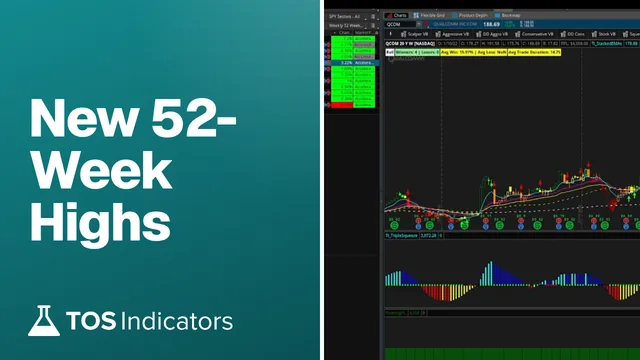 Which Stocks Made a New 52-Week High This Week?thinkScript tutorial · Free
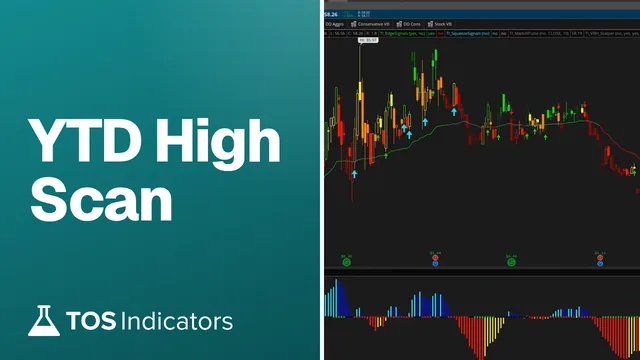 How to Scan for Stocks That Hit YTD High on Dec. 31?thinkScript tutorial · Free
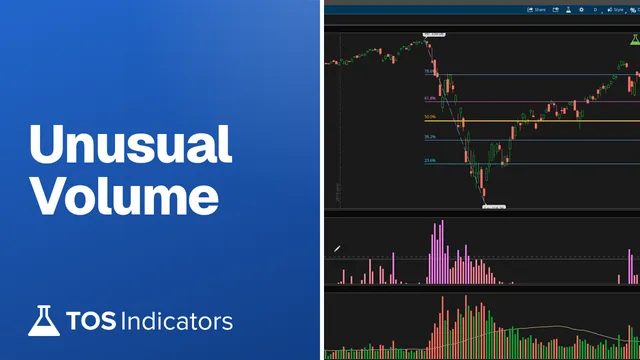 Unusual VolumeScan · Free
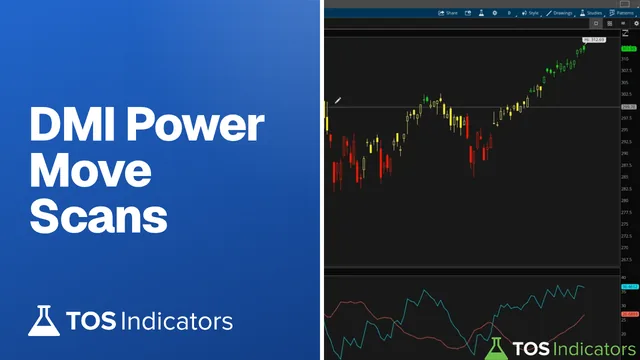 DMI Power Move ScansScan · Free
Get each new indicator by email
One email on Sundays with the week's new tool and its code. A free account also unlocks every .txt download.
No credit card. Unsubscribe anytime.