
Latest Research
Explore data-driven trade patterns, research, setups, and tools
cATEGORIES
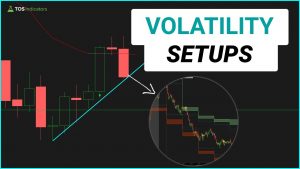
Day Trade Volatility With These 3 Setups
I’ll share the 3 setups that I’m focusing on trading, to profit from this current increase in volatility.
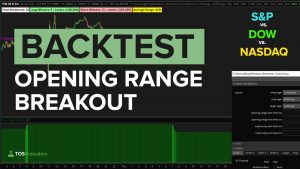
Opening Range Breakout Strategy Success Rate on Indices
I’ll show you how to use the Opening Range Breakout Backtester to discover if the ORB strategy is profitable on any of the 4 major index markets.
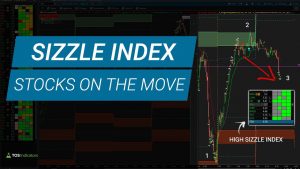
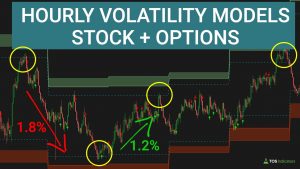
Hourly Volatility Models for Stocks – Demo on FDX and UPS
FDX and UPS were two stocks that stood out on our hourly Sizzle Index indicator, for leading the charge when the markets were chopping around sideways.
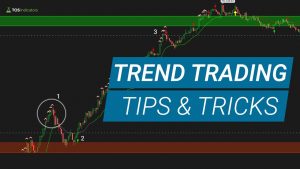
Trend Trading – Early Trend Signs
Discover hidden price and volatility clues in the market every morning, to find early trend signs. Learn how to recognize these patterns, and profit from them.
Bear Market Relief Rally – A Deep Dive in SPY, QQQ, DIA, and IWM
A deep dive into a bear market relief rally, and sharing research for previous relief rallies in the S&P 500, DOW, NASDAQ and Russell 2000 indices.
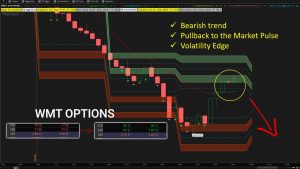
Hourly Volatility Models for Stocks – Demo on WMT
Walmart, along with a majority of retail stocks, faced a great deal of volatility today. That volatility is our opportunity, to take advantage of price/volatility edges in the marketplace.
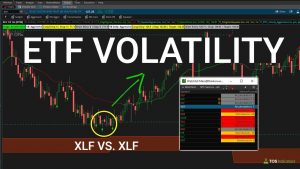
Hourly Volatility Models for Stocks – Demo on ETFs
I’ll show you the models being applied for the SPY sector ETFs, contrasting markets like XLV vs. XLF, XLP vs. XLY, etc. to show you what different volatility regimes looked like.
Hourly Volatility Models for Stocks – Demo on AAPL
I’ll give you a demo of our new HOURLY volatility models, to help you find intraday reversals in your favorite stocks and ETFs.
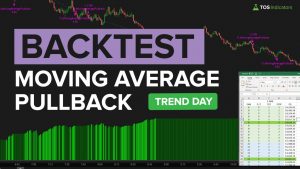
What Moving Average Pullback is Best for Trend Days?
Backtest which moving average is best-suited for moving average pullback setups on TREND days.
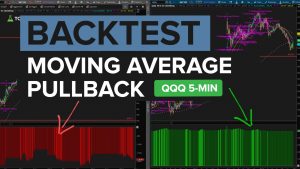
What Moving Average Pullback is Best for QQQ 5-MIN Chart?
Find out which moving average pullback leads to the greatest P/L, inside of the NASDAQ (QQQ), on a 5-minute timeframe chart.
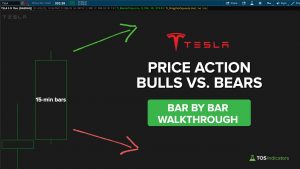
TSLA: Price Action Review (15-Minute Bar by Bar)
Inspired by Al Brooks, in today’s video, I’ll walk through the entire day’s price action, bar-by-bar on a 15-minute chart in TSLA. We’ll compare bulls vs. bears, trends vs. chop, and scalps vs. longer trends.
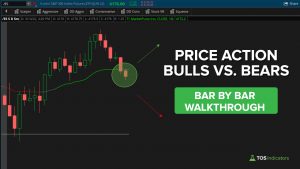
S&P 500: Price Action Review (5-Minute Bar by Bar)
Inspired by Al Brooks, in today’s video, I’ll walk through the entire day’s price action, bar-by-bar on a 5-minute chart. We’ll compare bulls vs. bears, trends vs. chop, and scalps vs. longer trends.
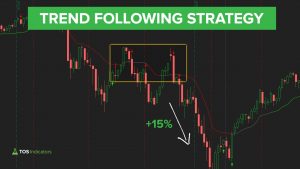
Trend Following Strategy – Walkthrough and Examples in S&P 500
I’ll walkthrough my favorite trend following strategy, broken down into a simple two step process. We’ll look at examples in the S&P 500, dating back to 2007-2008.
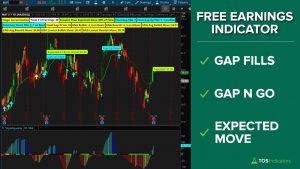
How to Trade the Day of Earnings with the Smarter Earnings Indicator
In today’s video, I’ll show you an example of using the Smarter Earnings indicator on 3 different stocks.
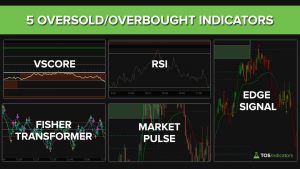
5 Oversold Indicators for ThinkOrSwim
In this video, we will compare and measure 5 different overbought/oversold confirmation signals against each other, to find which is the most effective indicator.