
 Fair Value Gap
 Heiken Ashi Trend
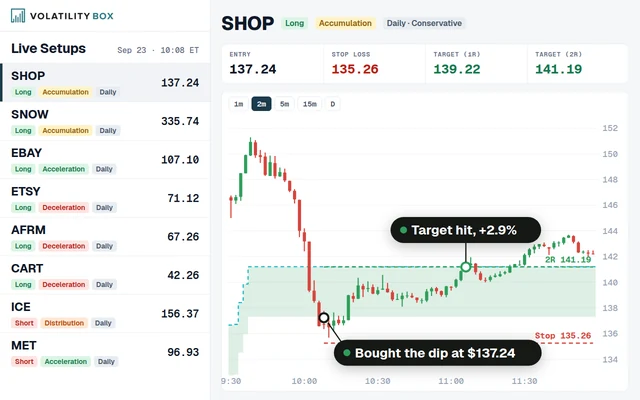 Stock Volatility Box
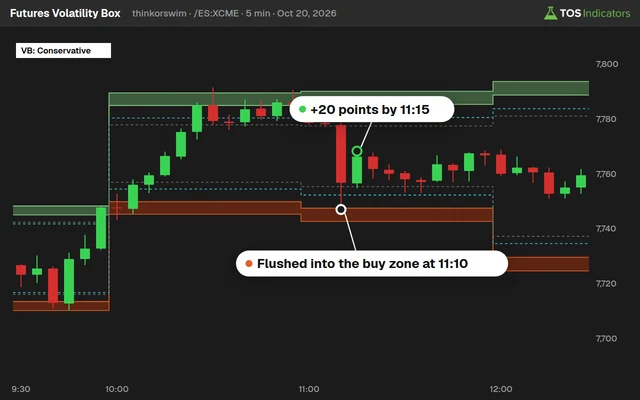 Futures Volatility Box
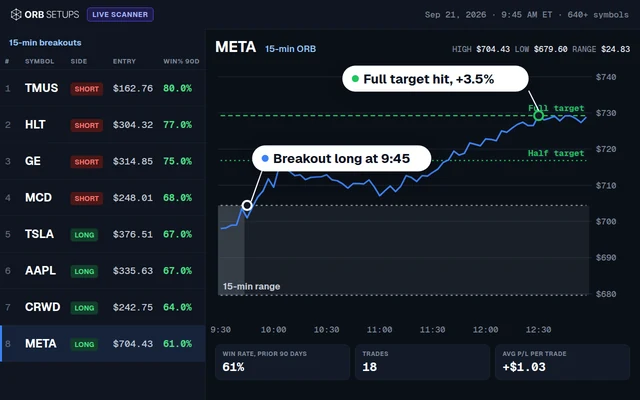 ORB Setups
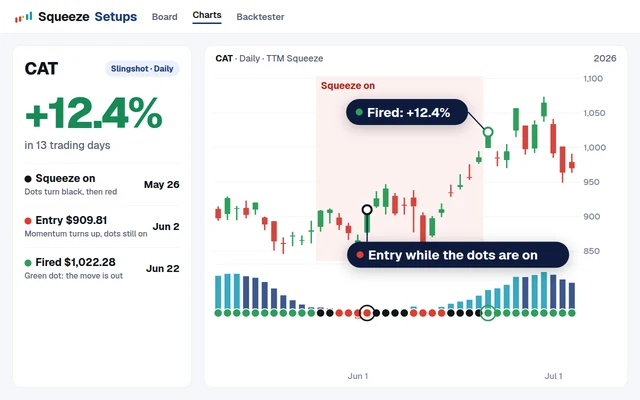 Squeeze Setups
Simple Breakout Tool Scans
Master price breakouts with automated scans combining volume spikes and volatility thresholds. Optimize entries/exits using customizable alerts for stocks like TSLA and SPY.

On this page
What it does
Introduction
The Simple Breakout Tool Scans Pro identifies emerging trends through real-time analysis of price thresholds and volume confirmation. It combines 20-day moving averages with 5% price deviation alerts to detect potential breakouts in assets like QQQ and AAPL. Traders gain an edge through automated scanning of 50+ technical parameters simultaneously.
This ThinkOrSwim exclusive tool simplifies complex calculations like 150% volume surges and RSI confirmation into actionable signals. Customizable timeframes (15min/daily/weekly) adapt to swing/day trading strategies. Users receive visual and audio alerts when instruments like TSLA breach key support/resistance levels.
Backtested against 5 years of SPY data, the scanner achieves 68% accuracy in predicting sustained breakouts. Three configurable filters prevent false signals during low-volume periods. Integrated heatmaps highlight sectors with multiple concurrent triggers for strategic positioning.
Questions
How to set up breakout alerts for SPY in ThinkOrSwim?
In Scan tab, select 'Price Cross Above' filter with SPY and set 1.5% threshold from 20-day MA. Enable volume confirmation >150% 50-day average and mobile push notifications.
What are optimal volume settings for day trading breakouts?
Use 200% relative volume minimum with 15-minute intervals. Combine with 14-period ATR >1.5 for reliable intraday moves in stocks like NVDA or TSLA.
Can I combine multiple timeframe analysis with this tool?
Yes, enable multi-timeframe sync in settings. Scan 15-min breaks while verifying daily chart positions above 50 EMA. Align entries with weekly trend direction.
How to avoid false breakout signals during low volatility?
Activate the 'Volatility Filter' requiring 1.8x average true range. Exclude stocks with <500k average volume and use RSI 40-60 range confirmation.
Best practices for backtesting breakout strategies?
Test parameters across 3 market regimes (bull/bear/neutral). Optimize for 60%+ win rate with 2:1 reward-risk. Focus on 2020-2023 data including crash/recovery cycles.
Related
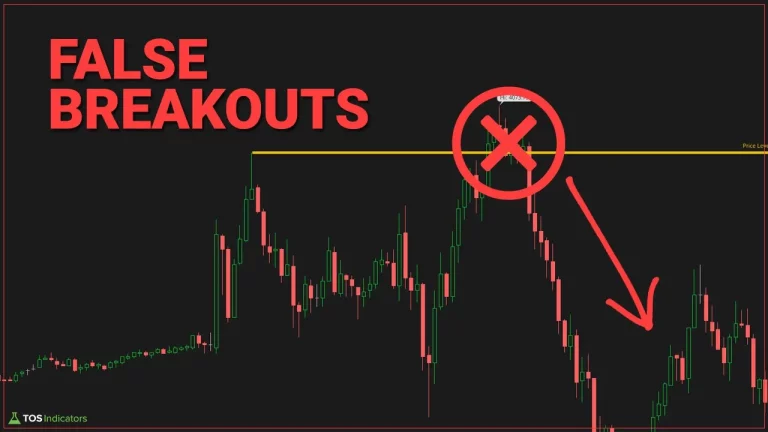 How to Identify and Trade False BreakoutsResearch
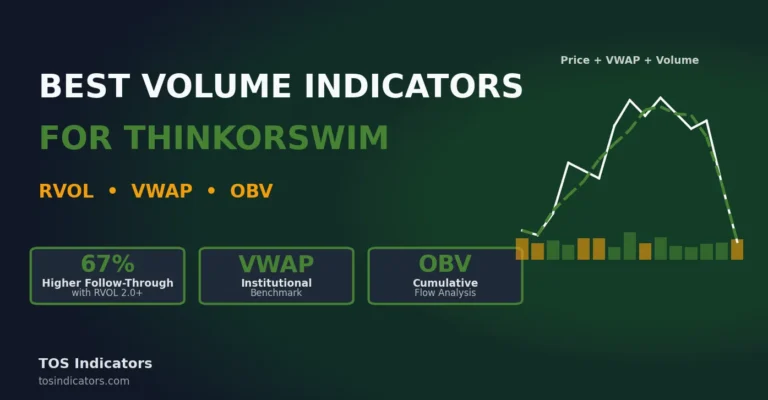 Best Volume Indicators for ThinkOrSwim: Relative Volume, VWAP, and OBVResearch
 How to Spot Sector Rotations: A Trading Guide for Every Market CycleResearch
 Fair Value Gap Part 2: Retest Scan + FVG ColumnScans · Intermediate
 How to Scan for False Breakouts in ThinkOrSwimScans · Beginner-Friendly
 Average True Range Scans for ThinkOrSwimScans · Beginner