
 Fair Value Gap
 False Breakout Scanner
 Heiken Ashi Trend

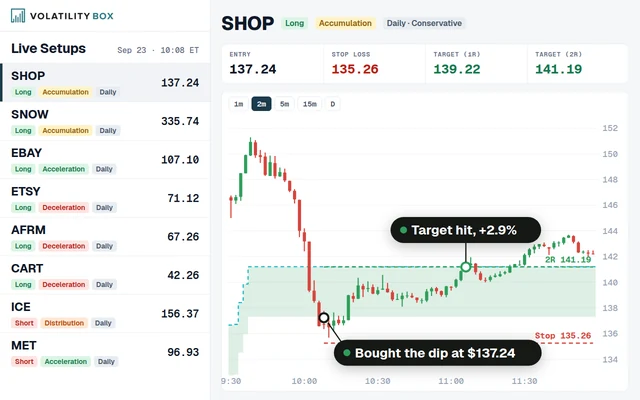 Stock Volatility Box
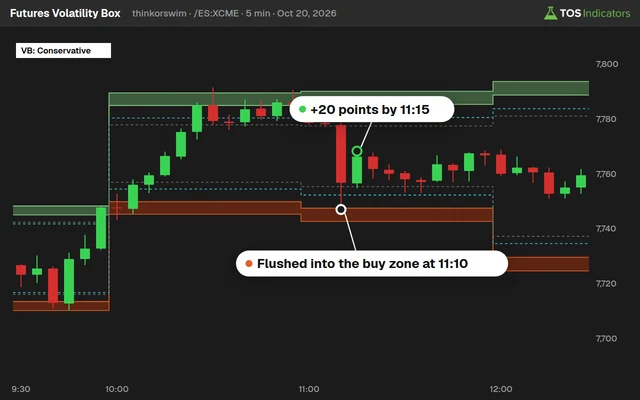 Futures Volatility Box
 ORB Setups
 Squeeze Setups
Measuring Relative Volatility Using the Volatility Box
In tonight’s video, we use the Volatility Box to show you an easy way to identify which markets are showing us more volatility than usual.
We start by comparing the S&P, DOW, Nasdaq and Russell futures. Nasdaq was carrying the S&P up higher, while the DOW was basically trading one step short of flat.
The Russell, on the other hand, was more volatile, and we were able to easily identify this within the first 30 minutes of the market open. The Russell had breached the Aggressive Volatility Box, which then was our cue to switch on over to the Conservative Volatility Box.
Similarly, we used our Stock Volatility Box Tool to generate the Volatility Boxes for a few different tickers, including Splunk (SPLK) and Exact Sciences (EXAS).
We could see very clearly that while price action had entered the clouds in SPLK, triggering a short entry (with fairly-liquid options), EXAS was not remotely close to our Volatility Box clouds.
And that's why it's important to have models that are custom-fitted for the tickers that you are trying to trade, instead of using a generic and inaccurate metric. The Volatility Box helps you to understand the personality of each specific symbol that is supported, and then trade appropriately.
Start trading with an edge, at the edge, and sign up for the Volatility Box today
 Is Apple Stock a Buy Right Now?
 Three Key Levels to Trade in NVDA for 2025
 Pay Attention to These Levels in NVDA Stock
 Instantly Reduce Risk and Increase Reward
 Nvidia Earnings Patterns After a “Beat”
 The Power of Multi-Time Frame Trends