
 Fair Value Gap
 False Breakout Scanner
 Heiken Ashi Trend
 Stock Volatility Box
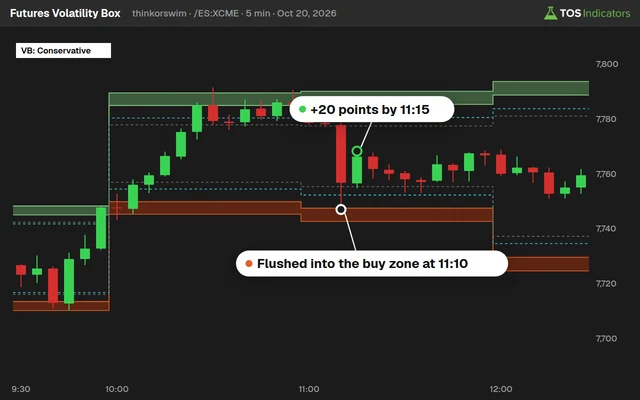 Futures Volatility Box
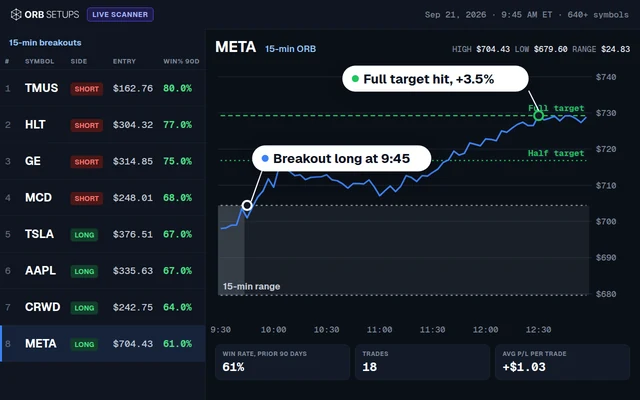 ORB Setups
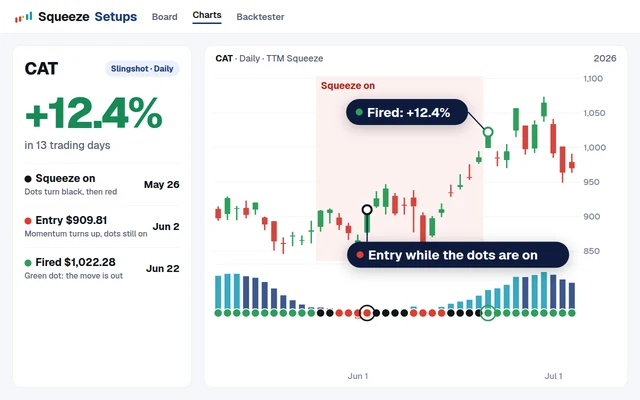 Squeeze Setups
On this page
EZA on Nov 10
EZA closed down 2.02%. It is in a squeeze on 2 of 12 timeframes, Market Pulse is in the Acceleration stage, and price is 1.5 ATR above its VMA.
In a squeeze on 2 of 12 timeframes.
No squeeze on the daily chart.
See it in MTF SqueezeSlingshot triggers in Squeeze Setups
In a squeeze Fired None. Join free for each timeframe's tier and bar count.
Market Pulse is green, in the Acceleration stage.
Acceleration since Nov 9, 2 sessions in a row, and on 2 of the last 12.
Market Pulse indicator1.5 ATR above its VMA.
67.79 against a VMA of 65.50, 3.50% above.
Lagged SPY by 1.66 points.
0 of the 4 related symbols below closed higher on Nov 10.
Opening range, Nov 10
30-minute range: 67.73 to 68.16, $0.4300 wide
Price broke above the high in the 10:05 AM ET bar, then closed back inside the range at 67.79.
EZA Volatility Box levels
Everything above is free. These rows are where EZA is statistically stretched, from the aggressive and conservative Volatility Box models on daily and hourly data.
| Level | Daily, aggressive | Daily, conservative | Hourly, aggressive | Hourly, conservative |
|---|---|---|---|---|
| Upper 3 | ||||
| Upper 2 | ||||
| Upper 1 | ||||
| Last close | 67.79 | 67.79 | 67.79 | 67.79 |
| Lower 1 | ||||
| Lower 2 | ||||
| Lower 3 |
EZA's daily and hourly levels are in Stock Volatility Box ($169 a month) and the Bundle.
See plansEZA questions
Is EZA in a squeeze?
Yes. As of the Nov 10, 2026 close, EZA is in a squeeze on 2 of the 12 timeframes we track. No squeeze on the daily chart.
Is EZA in an uptrend?
Yes. Market Pulse has EZA in the Acceleration stage: price above its VMA with the 8, 21 and 34-bar VWMAs stacked up. Acceleration since Nov 9, 2 sessions in a row, and on 2 of the last 12.
What was EZA's opening range on Nov 10?
The first 30 minutes ran from 67.73 to 68.16, a range of $0.4300. Price broke above the high in the 10:05 AM ET bar, then closed back inside the range at 67.79.
Where are EZA's Volatility Box levels?
Stock Volatility Box and Bundle members see EZA's daily and hourly levels on this page and in the Volatility Box platform.
Free tools for reading EZA
 Multi-Time Frame (MTF) Squeeze Indicator for ThinkOrSwim
 Market Pulse Indicator for ThinkOrSwim: Find the 4 Market Stages
 Opening Range Breakout (ORB) Indicator for ThinkOrSwim
Read any symbol free
A free account shows each timeframe's squeeze tier and bar count on every symbol page, and unlocks the code for every free tool.
No credit card. Unsubscribe anytime.