Squeeze Setups
A live squeeze scanner built around the Slingshot Squeeze, with 22 years of backtest results behind it.
See it, $99/month →

All Indicators
Beginner-Friendly
25 mins
ThinkOrSwim
How to Build a Fair Value Gap Indicator in ThinkorSwim
Download our free Fair Value Gap indicator for ThinkorSwim. It shades every open bull and bear gap as a cloud, filters out narrow gaps with an ATR setting, and clears each gap once price fills it.
Download Indicator
Table of Contents
In this tutorial I build a fair value gap indicator for ThinkorSwim from scratch, one line of thinkScript at a time. It finds the three-candle gaps price leaves behind on a fast move, shades each one as a cloud on your chart, and takes the cloud off once price fills the gap.
Before writing any code, I measured more than 116,000 fair value gaps across 650 stocks and ETFs and 11 years of daily bars. Half of them were completely filled within 5 trading days. Gaps at least half an ATR wide held on their first retest about 9 times out of 10, so the indicator has an ATR filter built in that keeps only the wider gaps.
What Is a Fair Value Gap?
A fair value gap is a three-candle pattern. Candle 2 moves so fast that candle 1’s high and candle 3’s low don’t overlap. The empty space between them is the fair value gap. Price ran through that area so quickly that almost nothing traded there.
The bearish version is the same pattern flipped upside down. Candle 3’s high sits below candle 1’s low, and candle 2 is the fast candle again.
In thinkScript, candle 3 is the current bar and candle 1 is 2 bars back, so each side comes down to one comparison:
- Bull gap: the current low is above the high from 2 bars ago,
low > high[2]. - Bear gap: the current high is below the low from 2 bars ago,
high < low[2].
What 116,000 Fair Value Gaps Tell You
You’ve probably heard of fair value gaps, but you may not have seen numbers put to them. I tested more than 116,000 of them across 650 liquid stocks and ETFs, using 11 years of daily bars.
- Half of all fair value gaps were completely filled within 5 trading days.
- 7 out of 10 bullish gaps were revisited within a week, meaning price traded back into the gap.
- Gaps at least 0.5 ATR wide held on their first retest 89.5% of the time, about 9 times out of 10. For a bullish gap, holding means price came back, touched the gap, and closed back above the bottom of it.
The retest is the normal path for a fair value gap, so you can plan for it. Size matters too. Narrow gaps are mostly noise, which is why the indicator includes a filter that keeps the wider ones.
What the Fair Value Gap Indicator Does
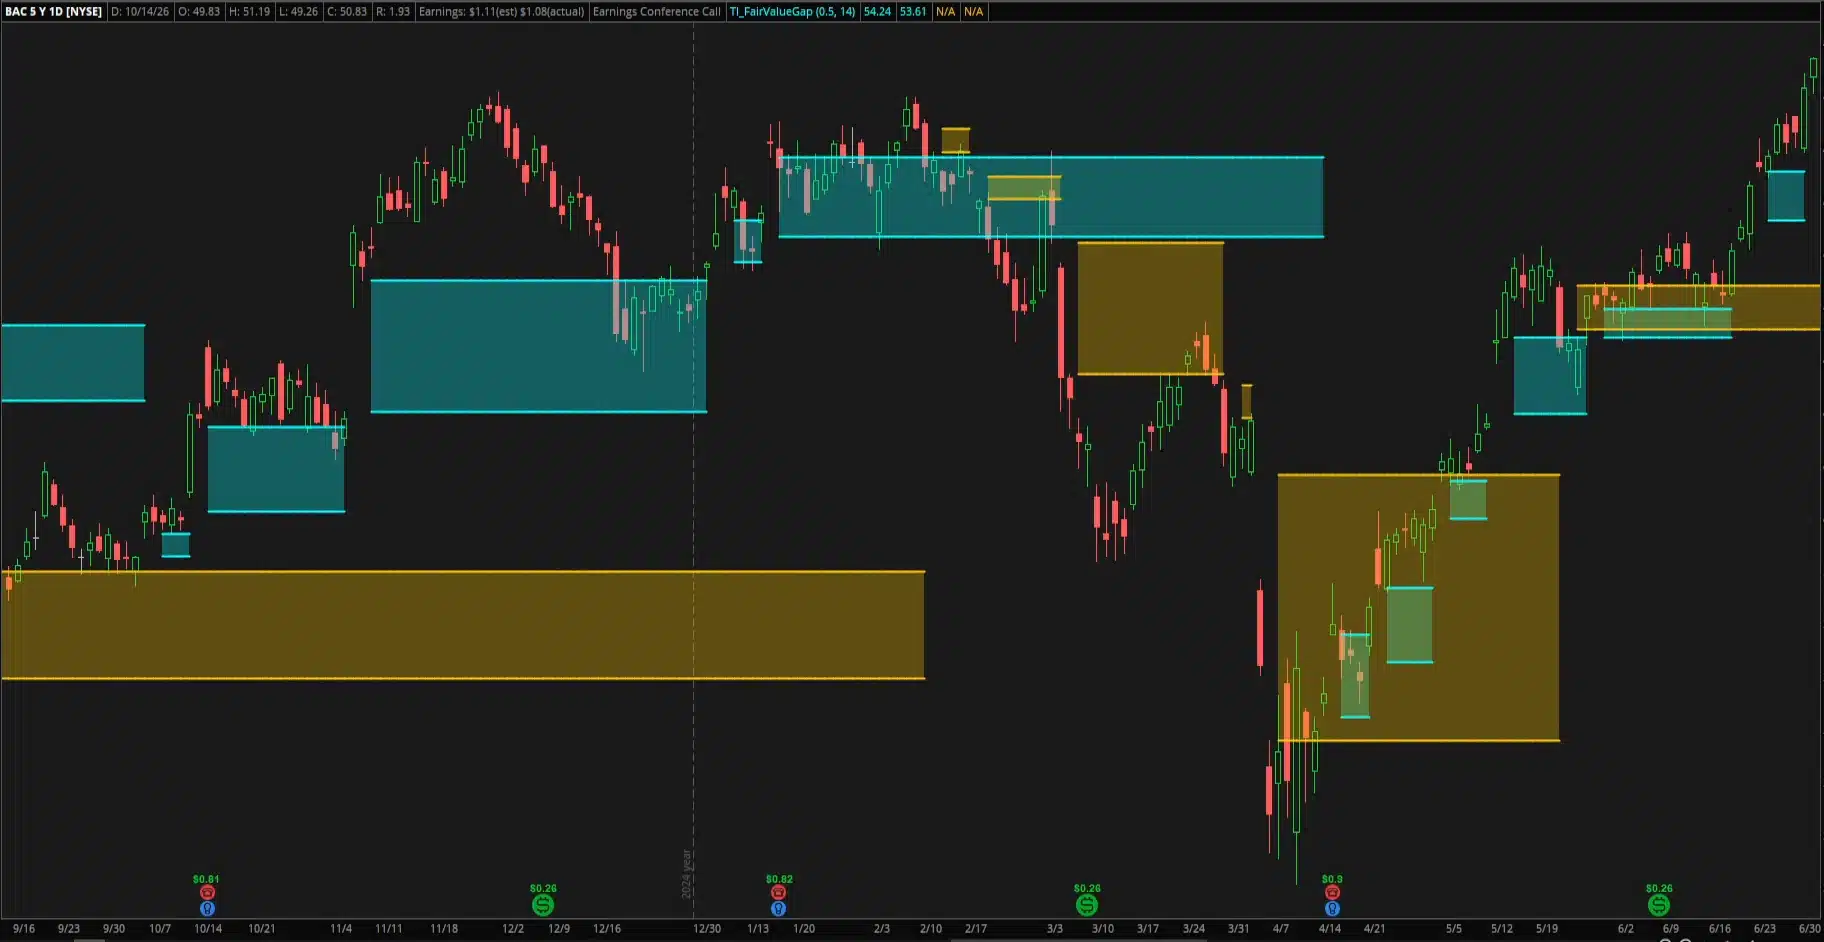
- Cyan and orange clouds. Cyan marks bull gaps and orange marks bear gaps. I picked those colors so the clouds stand apart from the red and green candles on your chart.
- The minGap filter. This input sets how wide a gap has to be, measured in ATRs. The default of 0.5 keeps gaps that are at least half of a 14-bar ATR wide.
- Gaps clear once filled. A bull gap comes off the chart when price trades down to its bottom edge. A bear gap comes off when price trades up to its top edge.
The indicator tracks the most recent bull gap and the most recent bear gap. When a new gap forms on the same side, it takes over from the previous one.
How to Install the Indicator in ThinkorSwim
- Download the indicator and open the .txt file, then copy all of the code. You can also copy it from the Code tab on this page.
- In ThinkorSwim, click the Studies icon, then click Create.
- Delete the placeholder code and paste in the fair value gap code.
- Give the study a name. I called mine
TI_FairValueGap. - Click OK, then Apply. I’d start on a daily chart, which is what I used in the video and in the study.
If you’ve never added a custom study before, our walkthrough on how to import a ThinkScript study into ThinkorSwim covers the same steps with screenshots.
The Inputs
Both inputs show up in the study settings, so you can change them without touching the code.
| Input | Default | What it controls |
|---|---|---|
minGap |
0.5 | The minimum gap width, as a multiple of ATR. Raise it to see only wide gaps, lower it to see more of them. |
ATRLength |
14 | The number of bars in the ATR average that minGap is measured against. |
In the video I raised minGap from 0.5 to 1 to see only the really wide gaps, then dropped it to 0.1 to see almost every gap on the chart. Try a few values on the symbols you trade and keep the threshold you like.
How the Code Works
Step 1: The ATR Filter
To tell a wide gap from a narrow one, I use ATR as the yardstick. ThinkorSwim has a built-in ATR function you could call instead. I wrote it out with Average and TrueRange so you can see what it calculates, and pulled the length out as an input.
input minGap = 0.5;
input ATRLength = 14;

def ATR = Average(TrueRange(high, close, low), ATRLength);
Step 2: Define Bull and Bear Gaps
Each gap has two conditions. The candles can’t overlap, and the size of the gap, found by subtracting the two prices, has to be at least minGap times the ATR. With the default of 0.5, a gap has to be at least 50% of the ATR on your current timeframe.
def bullGap = low > high[2] and (low - high[2]) >= minGap * ATR;
def bearGap = high < low[2] and (low[2]- high) >= minGap * ATR;
While building this, I used AddChartBubble to check that each gap showed up where I expected it. That line is still at the bottom of the code, commented out, if you want to use it to debug your own changes.
Step 3: Carry the Gap Forward Without Arrays
ThinkorSwim doesn’t have arrays, so I declare bullTop and bullBottom first and set them inside an if/else block. On the bar where a bull gap forms, the top is the current low and the bottom is the high from 2 bars ago. On every bar after that, each variable takes its value from the previous bar, which carries the gap forward.
def bullTop;
def bullBottom;
if (bullGap) {
    bullTop = low;
    bullBottom = high[2];
} else if low <= bullBottom[1]{
    bullTop = Double.nan;
    bullBottom = Double.nan;
}
else {
    bullTop = bullTop[1];
    bullBottom = bullBottom[1];
};
The middle branch clears the gap. Once the low trades down to the bottom of the bull gap, both values reset to Double.nan and the cloud comes off the chart. The bear side mirrors this: the top is the low from 2 bars ago, the bottom is the current high, and the gap clears once the high reaches the top.
Step 4: Plot the Gaps as Clouds
If you plot bullTop directly, you get one continuous line that connects each gap to the next. To fix that, the plot skips the bar where a gap forms by returning Double.nan on that bar, so each new gap starts fresh.
plot BullGapTop = if bullGap then Double.nan else BullTop;
plot BullGapBottom = if bullGap then Double.nan else BullBottom ;

plot BearGapTop = if BearGap then Double.nan else BearTop;
plot BearGapBottom = if BearGap then Double.nan else BearBottom;
From there, AddCloud shades the space between each top and bottom. The code also sets each line to cyan or orange with a line weight of 2 so the edges are easy to see.
AddCloud(BullGapTop, BullGapBottom, color.cyan, color.cyan);
AddCloud(BearGapTop, BearGapBottom, color.orange, color.orange);
How to Read the Gaps
This is what I look for on the Bank of America daily chart from the video.
- A pullback into a cyan gap that holds. Bank of America left a bull gap behind on the November 2024 election rally. In December, price came back down into it, never closed below the bottom of the cloud, and turned back up. January told a similar story: another gap up, a pullback into the gap, the bottom held, and price bounced.
- A push into an orange gap that gets turned away. In February, price poked up into 2 small bear gaps and was rejected quickly. The bear gap from March was wider. Price climbed back into it at the end of March, stalled, and rolled over right before the April sell-off.
- How wide each gap is. You can see at a glance which gaps are wide, which are narrow, and how far price has already traded into each one. The wide ones are the gaps the data favors.
I use the gaps as levels to plan around. The data shows price comes back to them often, and the indicator shows you exactly where they sit, so line up the retest with the rest of your setup before you take a trade.
Part 2 for Pro Members
Pro members get a Part 2 of this tutorial. In it, I build on this indicator to create a scan that finds stocks the moment they come back to test an open fair value gap. We also build a dashboard script for the scan tab that shows each stock’s fair value gap levels, color coded so they’re quick to read.
Educational content only. Nothing here is a trade recommendation or investment advice.
Fair Value Gap Indicator.ts
input minGap = 0.5;

input ATRLength = 14;

def ATR = Average(TrueRange(high, close, low), ATRLength);

#bull gaps

#bear gaps

def bullGap = low > high[2] and (low – high[2]) >= minGap * ATR;

def bearGap = high < low[2] and (low[2]- high) >= minGap * ATR;

def bullTop;

def bullBottom;

if (bullGap) {

    bullTop = low;

    bullBottom = high[2];

} else if low <= bullBottom[1]{

    bullTop = Double.nan;

    bullBottom = Double.nan;

}

else {

    bullTop = bullTop[1];

    bullBottom = bullBottom[1];

};

def bearTop;

def bearBottom;

if (bearGap) {

    bearTop = low[2];

    bearBottom = high;

} else if (high >= bearTop[1]){

    bearTop = Double.nan;

    bearBottom = Double.nan;

}

else {

    bearTop = bearTop[1];

    bearBottom = bearBottom[1];

};

plot BullGapTop = if bullGap then Double.nan else BullTop;

plot BullGapBottom = if bullGap then Double.nan else BullBottom ;

plot BearGapTop = if BearGap then Double.nan else BearTop;

plot BearGapBottom = if BearGap then Double.nan else BearBottom;

BullGapTop.setDefaultColor(color.cyan);

BullGapBottom.setDefaultColor(color.cyan);

BearGapTop.setDefaultColor(color.orange);

BearGapBottom.setDefaultColor(color.orange);

AddCloud(BullGapTop, BullGapBottom, color.cyan, color.cyan);

AddCloud(BearGapTop, BearGapBottom, color.orange, color.orange);

BullGapTop.setLineWeight(2);

BullGapBottom.setLineWeight(2);

BearGapTop.setLineWeight(2);

BearGapBottom.setLineWeight(2);

#AddChartBubble(bullGap, close, bullGap, color.yellow);
Want the .ts file and the one-click import? Both come with a free account.
A fair value gap is a three-candle pattern. Candle 2 moves so fast that candle 1's high and candle 3's low don't overlap, and the empty space between them is the gap. On the bearish side, candle 3's high sits below candle 1's low. Price moved through that space so quickly that almost nothing traded there.
Download the .txt file and copy the code, or copy it from the Code tab on this page. In ThinkorSwim, click the Studies icon, then Create. Delete the placeholder code, paste in the fair value gap code, name the study (I used TI_FairValueGap), and click OK, then Apply.
Cyan clouds are bull gaps, where the current bar's low is above the high from 2 bars ago. Orange clouds are bear gaps, where the current bar's high is below the low from 2 bars ago. Each cloud spans from the top of the gap to the bottom and stays on the chart until price fills it.
minGap sets the minimum gap width as a multiple of ATR. The default of 0.5 keeps gaps that are at least half of a 14-bar ATR wide. Raise it to 1 to see only the really wide gaps, or drop it to 0.1 to see almost every gap on the chart.
Size matters. In my study of more than 116,000 fair value gaps, gaps at least 0.5 ATR wide held on their first retest 89.5% of the time, about 9 times out of 10. The narrow gaps are mostly noise, so the filter keeps the chart focused on the wider ones.
A bull gap clears once price trades down to its bottom edge, and a bear gap clears once price trades up to its top edge. The indicator also tracks the most recent gap on each side, so a new bull gap takes over from the previous bull gap, and the same goes for bear gaps.
Across 650 stocks and ETFs and 11 years of daily bars, half of all fair value gaps were completely filled within 5 trading days, and 7 out of 10 bullish gaps were revisited within a week. The retest is the normal path for a fair value gap.
I built and tested it on daily charts, and that's where I'd start. The code reads whatever chart you load it on, so it also plots on intraday and weekly charts. The ATR is calculated from the same bars, so the minGap filter scales with the timeframe.
Here are some resources that you may find useful:



Ready to Trade With an Edge?
Join 40,000+ traders using institutional-grade tools for ThinkOrSwim.
Get the Bundle