
 Fair Value Gap
 False Breakout Scanner
 Heiken Ashi Trend

 Stock Volatility Box
 Futures Volatility Box
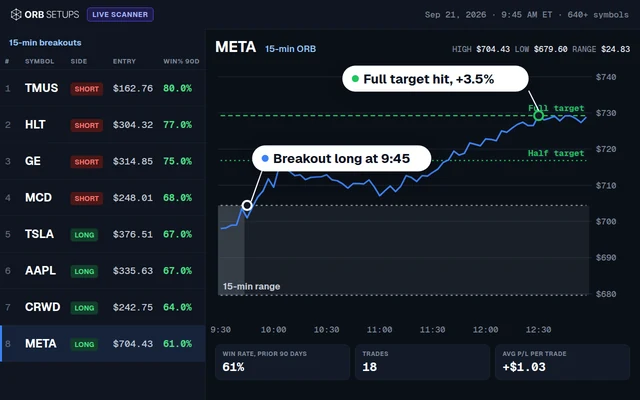 ORB Setups
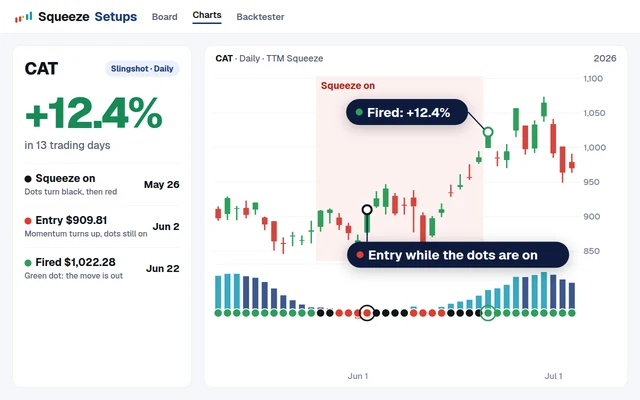 Squeeze Setups
How to Build a Relative Performance Dashboard in ThinkorSwim
Our relative performance dashboard is a sortable ThinkorSwim column that shows how far each stock in a watchlist or scan beat or lagged SPY over 30 bars.

On this page
What it does
In this tutorial I turn our free Relative Performance indicator into a relative performance dashboard: a custom column for a ThinkorSwim watchlist or the scan tab that shows how far each stock's return is ahead of or behind SPY over the last 30 bars. Sort the column and the biggest outperformers move to the top.
The change takes 1 new line of code and 1 new label. It's for traders who want to rank a long list, like the 621 stocks my scan returned in the video, instead of checking charts one at a time. The comparison logic itself is covered on the indicator page.
Included with Volatility Box and the Bundle
The full walkthrough, the thinkScript code, the download and the build video for How to Build a Relative Performance Dashboard in ThinkorSwim are for Volatility Box and Bundle members, along with every other members-only tool and the Squeeze Course.
Questions
What is the relative performance dashboard?
The relative performance dashboard is a custom column for a ThinkorSwim watchlist or the scan tab, built from our free Relative Performance indicator. It shows each stock's return over the last 30 bars minus SPY's return over the same bars, as a decimal. Green text means the stock outperformed SPY, yellow means it didn't, and you can sort the list by the column.
How do I add the relative performance dashboard to ThinkorSwim?
Download the PDF from this page and copy its shared link. In ThinkorSwim, click Setup in the top right corner, choose Open shared item, paste the link and import the custom quote. Then open Customize on your watchlist or scan tab and add the column. You can also build it from the indicator code in a free custom quote.
How do I add a custom column to the ThinkorSwim scan tab?
Click the settings icon on the Scan tab and choose Customize. Find the custom quote you created, called Rel Performance in the video, add it to your current set of columns and click OK. The column then fills in for every scan result. In the video it ranked 621 stocks from a weeklies scan.
What does the number in the Rel Performance column mean?
It is the stock's return minus the benchmark's return over the same lookback, written as a decimal. A positive number means the stock beat SPY, and 0.28 is about 28 percentage points ahead. In the video, Ford returned 36.66% against 8.61% for SPY over 30 daily bars, a difference of about 28 points.
Why won't my custom column sort after I add AsPercent?
In the video, wrapping the value in AsPercent turned the column into text, and ThinkorSwim no longer sorted it correctly. Multiplying the value by 100 did the same. Round(performanceDiff, 3) kept it sortable. Leave the label as plain performanceDiff and read the decimal as a percentage: 0.28 is about 28 points.
How do I compare stocks against QQQ instead of SPY?
The video keeps SPY, but the benchmark is an input line in the code. Open the column with Edit formula and change "SPY" to "QQQ", or to a sector ETF such as XLK. The rest of the code stays the same. To keep the SPY version too, paste the code into a second custom quote, which uses another of your custom quote slots.
Why does the relative performance column show N/A?
ThinkorSwim needs a moment to calculate the column for every symbol in the list. In the video the values showed N/A at first and turned into numbers once the calculation finished. If you switched the code to date mode, also check that the date input is a trading day written as YYYYMMDD, since the code needs a bar with that exact date.
How is the dashboard different from the relative performance indicator?
The indicator labels one chart at a time with Outperform or Underperform and both returns as percentages. The dashboard runs the same calculation as a column for every symbol in a watchlist or scan and shows the difference between the two returns, so you can sort the list. The indicator page explains how the returns are calculated.
Related
 How to Build a Relative Performance Indicator in ThinkOrSwimIndicators · Beginner
 How to Add Labels in ThinkOrSwim With AddLabel (6 Examples)thinkScript · Beginner
 How to Build a Market Pulse Dashboard in ThinkOrSwimDashboards · Beginner
 Hourly Sizzle Index Dashboard for ThinkOrSwimDashboards · Beginner
 Unusual Volume Dashboard for ThinkOrSwim: A Watchlist Column in Standard DeviationsDashboards · Beginner
 How to Build a TTM Squeeze Dashboard in ThinkOrSwimDashboards · Intermediate