
 Fair Value Gap
 False Breakout Scanner
 Heiken Ashi Trend
 Stock Volatility Box
 Futures Volatility Box
 ORB Setups
 Squeeze Setups
On this page
Overview
In this tutorial I build two increasing volume scans for ThinkOrSwim from scratch. The bullish scan finds stocks where volume has climbed for 3 bars in a row, each of those bars is above its 50-bar average, and each one closed higher than the bar before it. The bearish scan looks for the same volume pattern on red bars.
The whole scan is two lines of thinkScript, built on the free VolumeAvg study that comes with ThinkOrSwim. I use it to find momentum stocks and trends that may be starting to form, and you can run it on daily, weekly or intraday bars.
Key Takeaways
- The increasing volume scan finds stocks with 3 bars in a row of rising, above-average volume.
- The bullish version needs each of those bars to close above the previous close (green volume bars). The bearish version needs closes below the previous close (red bars).
- The scan is 2 lines of thinkScript built on the free VolumeAvg study in ThinkOrSwim, using its 50-bar average.
- In the video, a price filter above $20 and a 500,000-share volume filter cut about 6,500 symbols to 1,396, and the bullish daily scan returned 2 stocks.
- The same code runs on daily, weekly or intraday bars. The aggregation setting on the filter picks the timeframe.
What the Increasing Volume Scan Looks For
The increasing volume scan is a ThinkOrSwim stock scan that looks for 3 bars in a row of accelerating volume. A chart gives you two basic pieces of information, price in the upper panel and volume underneath it, and this scan works on the volume side. Each of the 3 bars has to pass all three of these checks:
- Above-average volume. Volume on the bar is higher than its 50-bar average.
- Rising volume. Volume on the bar is higher than volume on the bar before it, so the histogram steps up 3 times.
- The right color. For the bullish scan, the bar closes above the previous close, which ThinkOrSwim colors green. For the bearish scan, the bar closes below the previous close, which it colors red.
When all three hold for 3 straight bars, volume is accelerating in one direction. That's the pattern I look for when I want to find a momentum stock or catch a new trend early. The table shows how the two versions of the scan differ.
| Check on each of the 3 bars | Bullish scan | Bearish scan |
|---|---|---|
| Volume vs its 50-bar average | Above | Above |
| Volume vs the previous bar | Higher | Higher |
| Close vs the previous close | Higher | Lower |
| Volume bar color in ThinkOrSwim | Green | Red |
How It Differs From the Unusual Volume Scans
The unusual volume scans and the increasing volume scan measure different things. Our unusual volume scans compare volume to a relative standard deviation, so they flag volume that is far above normal.
This scan uses a plain 50-bar average through the VolumeAvg study and adds a second requirement: volume has to keep rising, bar after bar. Run both if you want to see spikes and steady builds side by side. For a members-only view of the same idea across a watchlist, the Unusual Volume Dashboard puts it in a scan tab column.
The VolumeAvg Study Behind the Scan
VolumeAvg is a free study built into ThinkOrSwim, and it's the only study the scan reads. Search for VolumeAvg in the studies list and add it to a chart to see the same numbers the scan reads. Two of its plots matter here:
Volis the volume of each bar.VolAvgis the average volume over the study's length, which defaults to 50. On a daily chart, that's the average volume of the past 50 days.
The study also colors each volume bar. A bar is green when the close is above the previous close and red when it is below. The scan uses that same comparison, so its results match the colors you see under your chart. If you want average volume printed as a number on the chart instead, our Average Volume Stats indicator does that.
How to Build the Scan in ThinkOrSwim
- Open the Scan tab and start a fresh stock scan with no filters loaded.
- Click Add filter, choose Stock, and set a price filter. I used a price above $20.
- Add a second stock filter for volume of at least 500,000 shares to remove illiquid names. In the video, these two filters cut the list from about 6,500 symbols to 1,396.
- Click Add filter again and choose Study. Open the dropdown that shows ADXCrossover, pick Custom, and switch to the thinkScript Editor tab.
- Paste in the code below, set the aggregation to D for daily bars, click OK, and run the scan.
When I recorded the video, custom study filters worked only in a live ThinkOrSwim account, not in paperMoney.
The Code, Line by Line
The increasing volume scan is two lines of thinkScript. Before writing any code, I planned it that way. The first checks the three volume conditions on a single bar. The second checks whether that happened 3 bars in a row. If you're new to referencing a built-in study by name, our AddLabel tutorial covers the same Study().Plot syntax.
Line 1: The Volume Condition
The first line calls the VolumeAvg study directly. The parentheses after VolumeAvg tell ThinkOrSwim it's a built-in study, and the name after the dot picks which plot to read.
This step’s code is free with an account. Create one or sign in.
Read it top to bottom: volume is above its 50-bar average, volume is higher than on the previous bar, and the bar closed above the previous close. You can type volume in place of VolumeAvg().Vol if you prefer. Both return the same number.
Line 2: Three Bars in a Row
This step’s code is free with an account. Create one or sign in.
volCondition equals 1 on a bar where all three checks pass and 0 where any of them fail. Sum adds it up over the last 3 bars, so a total of 3 means the condition held on each of them. To ask for 4 bars in a row, change both 3s to 4.
The Bearish Version
The bearish increasing volume scan changes one comparison. To scan for selling pressure, flip the last check so the scan looks for red bars:
This step’s code is free with an account. Create one or sign in.
The two volume checks stay the same. Volume still has to be above average and rising. Only the direction of the close changes.
What the Scan Found in the Video
The scan returned a short list on every run in the video. These results come from the day I recorded, so your list will be different, but the charts show the pattern to look for.
- Daily, bullish. The scan cut 1,396 symbols down to 2: General Motors and Plymouth Industrial REIT (PLYM). Both charts showed 3 green volume bars, each taller than the last and each above the 50-day average line.
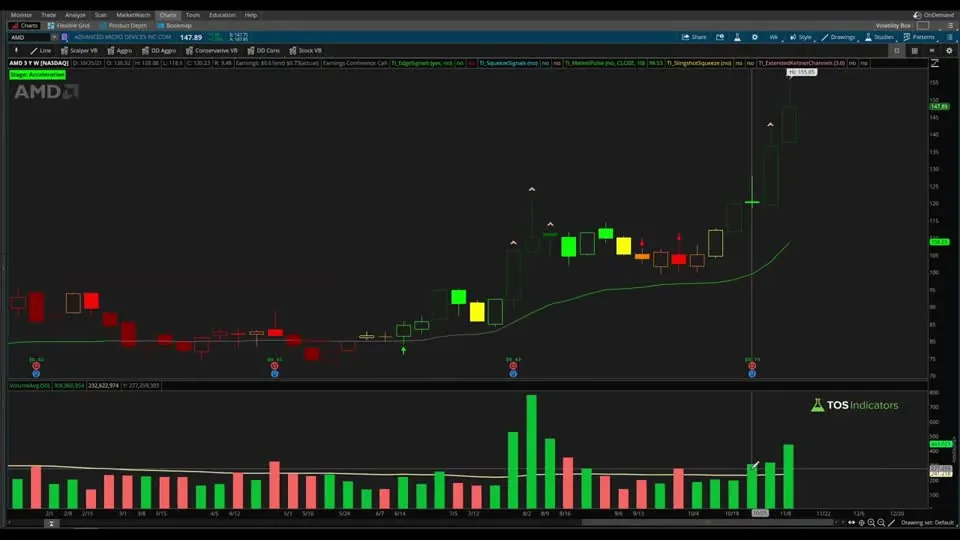
- Weekly, bullish. Switching the aggregation from D to W returned 4 stocks. AMD had 3 straight weekly bars of rising, above-average volume, all green.
- Daily, bearish. The red-bar version returned 3 symbols, including JAMF and USO. JAMF's red bars came in the run-up to earnings, and the stock kept falling after the report.
How I Use the Results
The increasing volume scan builds a watchlist. It tells you volume is building in one direction, and it doesn't tell you where to enter or exit. I open each result on a chart and look at the price action and the levels around it before deciding anything.
Before you trade a name the scan finds, decide where your stop goes and size the position so a stop-out costs a small, fixed share of your account. Three days of rising volume can reverse on the fourth. For another momentum filter to pair with this one, try our rate of change scans.
Changing the Timeframe
The increasing volume code stays the same on every timeframe. The aggregation setting on the study filter decides what one bar is. Set it to D for daily bars, W for weekly bars, or an intraday period like 1 minute or 5 minutes if you day trade. On a weekly scan, the 50-bar average covers 50 weeks instead of 50 days.
How to Import the Ready-Made Scans
The increasing volume download is a .txt file with two ThinkOrSwim shared links, one for the bullish scan and one for the bearish scan. To load one:
- In ThinkOrSwim, click Setup in the top right corner.
- Choose Open shared item.
- Paste in the link and save the scan.
If the code you typed throws an error, import the shared scan and compare the two. Our guide on how to import a study or scan into ThinkOrSwim walks through shared items step by step, and you'll find more free scans on the scans page.
The scans on real data
Drawn from real daily bars with the code on this page, through Oct 20, 2026. The bullish scan needs 3 bars in a row with volume above its 50-bar average, higher than the bar before, and a close above the previous close. I ran both scans on the daily bars of every stock and ETF in our data, the way ThinkOrSwim would at each close.
The scans on Oct 20, 2026
The bullish scan returned 1: FITB. The bearish scan returned 2: SE, SRLN. Biggest dollar volume first.
QQQ, Sep 18, 2026
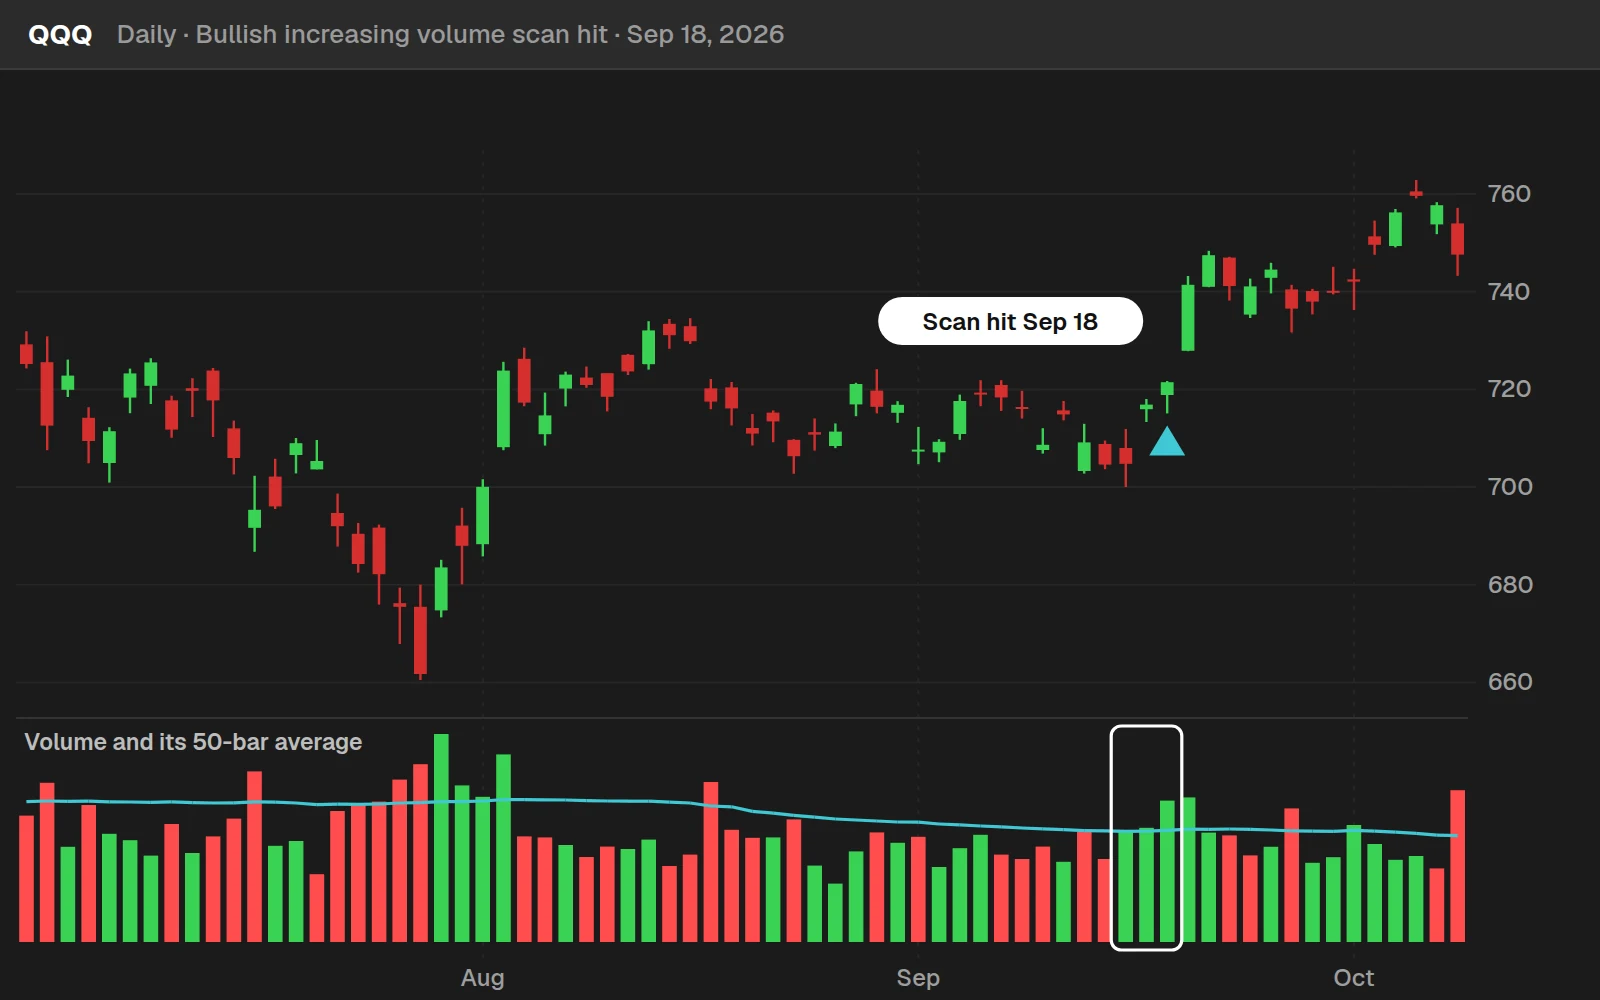
QQQ is the most recent hit among 44 well-known names. It closed at $721.45 on Sep 18, 2026 and at $749.58 ten trading days later, +3.9%.
By the numbers
Daily bars for every stock and ETF in our data, Oct 1, 2024 to Oct 20, 2026. A hit is the first day a scan is true. Each yardstick is every day in the same symbols and dates. The scan finds volume coming in; it says nothing about how long the move lasts.
Full thinkScript code
Create a free account or sign in to copy all 15 lines and download the file.
Download
Download the Increasing Volume Scans for ThinkOrSwim. The download is a .txt file with two ThinkOrSwim shared links, one for the bullish scan and one for the bearish scan. In ThinkOrSwim, click Setup in the top right corner, choose Open shared item, and paste in a link. You can also copy the code from the Code tab on this page into a new scan filter. If you haven't imported a shared item before, here's how to import into your ThinkOrSwim platform.
Questions
What does the increasing volume scan look for?
It looks for 3 bars in a row where volume is above its 50-bar average, volume is higher than on the bar before, and the bar closed above the previous close. The bearish version swaps the last check for a close below the previous close, which matches the red volume bars in ThinkOrSwim.
How do I scan for increasing volume in ThinkOrSwim?
Open the Scan tab, add a price filter and a volume filter to remove illiquid stocks, then add a Study filter. Choose Custom, open the thinkScript Editor, paste in the two lines of code from this page, set the aggregation to D for daily bars, and run the scan.
What is the VolumeAvg study in ThinkOrSwim?
VolumeAvg is a free study that comes with ThinkOrSwim. It plots the volume of each bar as Vol and the average volume over the last 50 bars as VolAvg. It colors each bar green when the close is above the previous close and red when it is below.
How do I switch the scan from bullish to bearish?
Flip the greater-than sign in the last condition to a less-than sign, so the scan checks for a close below the previous close. The volume checks stay the same, so the scan then finds 3 bars in a row of rising, above-average volume on red bars.
Can I run the increasing volume scan on intraday charts?
Yes. The code stays the same on every timeframe. Change the aggregation on the study filter to an intraday period such as 1 minute or 5 minutes, or to W for weekly bars. The 50-bar average then uses 50 bars of whatever period you choose.
How do I require more than 3 bars of increasing volume?
Change both numbers in the last line. Sum(volCondition, 4) == 4 asks for 4 bars in a row, and Sum(volCondition, 5) == 5 asks for 5. A longer run returns fewer stocks.
Why add price and volume filters before the custom filter?
They remove cheap and illiquid stocks before the volume condition runs. In the video, a price above $20 and volume of at least 500,000 shares cut the list from about 6,500 symbols to 1,396, and the custom filter took it from there.
How is this different from the unusual volume scan?
The unusual volume scans compare volume to a relative standard deviation, so they flag volume that is far above normal. The increasing volume scan compares volume to a 50-bar average and also requires volume to rise for 3 bars in a row.
Related tools
 Unusual Volume
 Volume Intensity
 Advanced Volume Zone Oscillator
 Average Volume Stats
 MACD Crossover Near Zero Line
 Anchored VWAP Scans
Get each new indicator by email
One email on Sundays with the week's new tool and its code. A free account also unlocks every .txt download.
No credit card. Unsubscribe anytime.