
 Fair Value Gap
 False Breakout Scanner
 Heiken Ashi Trend

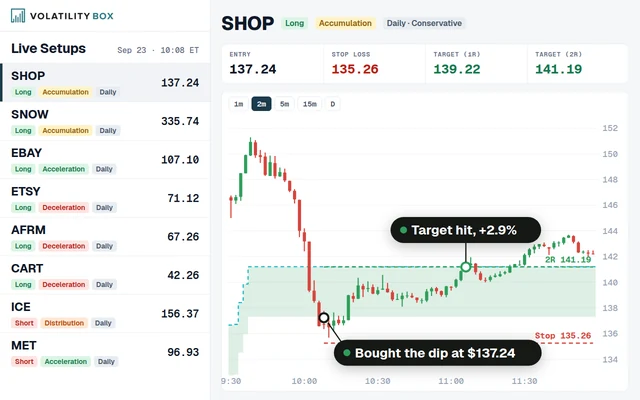 Stock Volatility Box
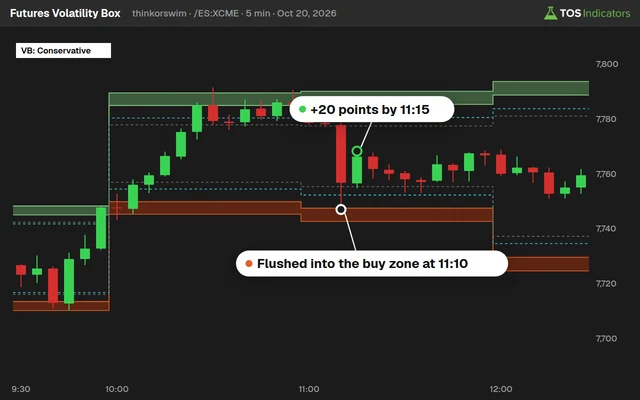 Futures Volatility Box
 ORB Setups
 Squeeze Setups
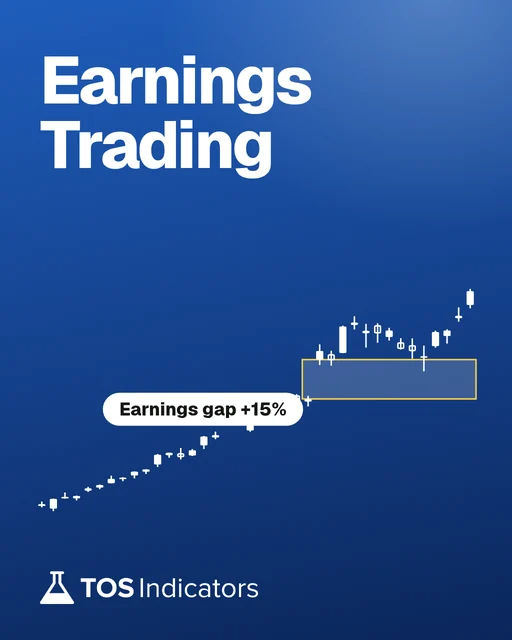
What Happened With UAL Earnings?
Yesterday, we created a game plan around trading United Airline's earnings (UAL).
We said, if UAL gapped up, then probabilities suggest that UAL tends to continue in the same direction for an average of ~$2.01, or to the nearest V-Score standard deviation at $90.33.
UAL did just that today. We gapped up, filled the (small) gap first, and then continued to trend towards $90.60, well above our first target.
Discussion for UAL is available in yesterday's post, here.
Below are some interesting statistics around earnings (using 2-yrs worth of earnings data) for tomorrow:
[su_list icon="icon:check-square-o" icon_color="#333333" indent="15" class=""]- CSX Transport (CSX) - Gap N Go 75% of the time on earnings beat
- International Business Machines (IBM) - Gap N Go 87.5% of the time
- Netflix (NFLX) - Gap N Go 62.5% of the time
- Crown Holdings (CCK) - Fills its gaps (Bearish preference) 87.5% of the time
- Crown Castle (CCI) - Gaps down and fills its gap 75% of the time on earnings beat
Trade Plan & V-Score Targets
As of writing this post at 5:30pm PT, the following trades look as though they will trigger:
[su_list icon="icon:check" icon_color="#333333" indent="15" class=""]- CSX - Gap N Go Bullish on Earnings Beat
- IBM - Gap N Go Bearish on Earnings Miss
- NFLX - Gap N Go Bullish on Earnings Beat
Below are some price targets, based on if the pattern that tends to happen repeats itself, and we get a move in the direction towards our bias.
The price targets are derived using the closest standard deviation, with the V-Score indicator.
[su_table responsive="no" alternate="no" fixed="no" class=""]| Ticker | Preference | Bias | Earnings | Avg $ Move | Nearest SD | Nearest +/-1 SD |
| UAL | Gap N Go | Bullish | - | $ 2.01 | $ 90.33 | $ 91.29 |
| UAL | Gap N Go | Bearish | - | $ 5.09 | $ 86.18 | $ 82.02 |
| ASML | Gap N Go | Bullish | - | $ 3.80 | $ 270.29 | - |
| CSX | Gap N Go | Bullish | Beat | $ 1.85 | $ 70.51 | $ 72.23 |
| IBM | Gap N Go | Bullish | $ 3.48 | $ 153.39 | $ 163.95 | |
| IBM | Gap N Go | Bearish | $ 2.66 | $ 138.49 | $ 131.68 | |
| NFLX | Gap N Go | Bullish | $ 4.43 | $ 292.94 | $ 319.41 | |
| NFLX | Gap N Go | Bearish | $ 3.20 | $ 245.47 | $ 207.62 | |
| CCK | Gap Fills | - | - | - | - | - |
| CCI | Gap Down Fill | Bullish | Beat | $ 134.57 | $ 153.13 |
Volatility Box Trade Report
We had a total of 0 trades that set up today, for a net P/L of $0.
Resources:
- Click here to download the Smarter Earnings indicator (FREE)
- Click here to download the V-Score indicator (FREE)
- Click here to download the Market Pulse (FREE)
- Click here to download the Simple Breakout Tool (FREE)
Sign up for a 30-day risk free trial to start trading with the Volatility Box.
 Is Apple Stock a Buy Right Now?
 Three Key Levels to Trade in NVDA for 2025
 Pay Attention to These Levels in NVDA Stock
 Instantly Reduce Risk and Increase Reward
 Nvidia Earnings Patterns After a “Beat”
 The Power of Multi-Time Frame Trends