
All ThinkOrSwim Indicators
Download our free and premium ThinkOrSwim indicators, and turn TOS into your personal trading assistant
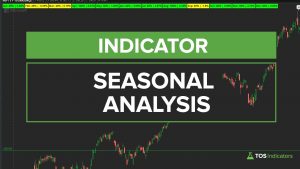
Seasonal Analysis
In this thinkScript tutorial, we’ll build a Seasonal Analysis indicator to identify recurring patterns and tendencies in your favorite stocks, ETFs, and futures.
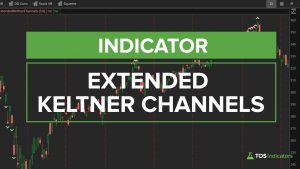
Keltner Channel Wedges
In this beginner thinkScript tutorial, we’ll build an indicator to alert us whenever we are in “overly extended” territory, as measured by the Keltner Channels.
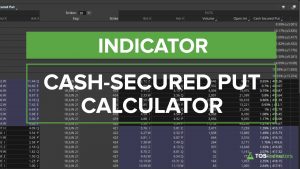
Cash-Secured Put Calculator
The Cash-Secured Put Calculator helps you quickly calculate return percentages and identify the best stocks to sell cash-secured puts.
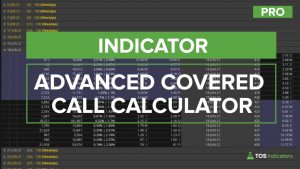
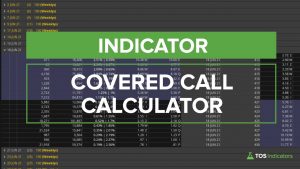
Covered Call Calculator
Build a simple, yet powerful Covered Call Calculator for ThinkOrSwim to find the most profitable calls to sell.
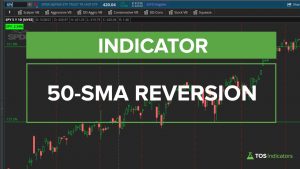
Reversion to 50 Day SMA
Learn how to build a “reversion to the mean” type indicator, using boolean variables and labels.
Wilder’s Momentum Concept
Explore the multi-decade old momentum concept created by Wilder, using a few, simple lines of code.
Cumulative TICK
Build a cumulative TICK indicator to track market internals ($TICK) in an efficient manner, keeping the count.
Option Chain Relative Value
We’ll use the implied volatility, along with our option’s pricing thinkScript to find opportunities and craft high-probability trades.
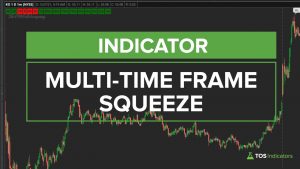
Multi-Time Frame (MTF) Squeeze Indicator
Build a multiple time frame squeeze that shows you all the different time frames in which we have a TTM_Squeeze.
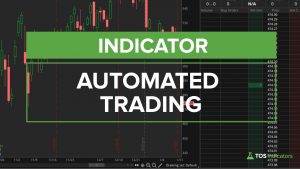
Beginner’s Guide to Automated Trading
The complete beginner’s guide to automated trading in ThinkOrSwim, with 8 different trading examples.
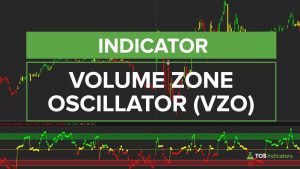
Volume Zone Oscillator
We’ll take the basic VZO indicator in ThinkOrSwim and extract meaningful patterns to turn it into a useful trend trading tool.
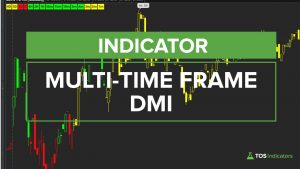
Multi Time Frame (MTF) DMI
Identify momentum waves changing across multiple time frames, and “calm before the storm” opportunities.
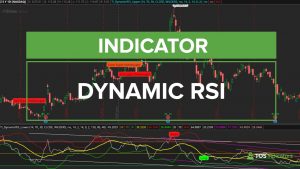
Dynamic RSI
Build a more powerful version of the RSI, that shifts and adapts to changing price condition and helps to identify overbought/oversold zones.
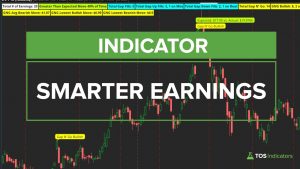
Smarter Earnings
Build your very own earnings indicator in 45 minutes, to help you trade the actual day of earnings using data.
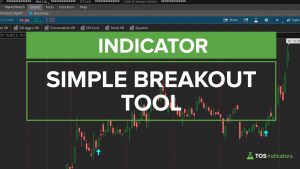
Simple Breakout Tool
Build a breakout indicator, using a simple, yet effective combination of moving averages and stochastics.
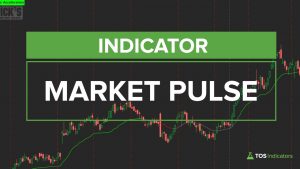
Market Pulse
Identify the 4 different market stages with one simple line, and replace the noise on your charts.
- « Previous
- 1
- 2
- 3
- Next »