
ThinkOrSwim Indicators
Download free custom indicators for ThinkOrSwim. Each indicator includes thinkScript code, installation instructions, and video tutorials showing you how to use it.
Most Popular ThinkOrSwim Indicators
These are our most downloaded and highest-rated custom indicators for ThinkOrSwim.
 Pro
Pro
Adv. Covered Call Calculator
Master the Adv. Covered Call Calculator Pro to spot high-probability trades, and transform your trading with proven strategies.
Learn More →
Anchored VWAP
Step-by-step tutorial showing how to build a custom Anchored VWAP indicator for ThinkOrSwim using ThinkScript. Learn to anchor VWAP to any date and time for precise support and resistance analysis.
Download Free →
Average Volume Stats
Learn to build a dynamic volume indicator for ThinkOrSwim that compares today's volume with historical averages using customizable timeframes and clean formatting.
Download Free →
Bollinger Bands Reversal
Master the most popular Bollinger Bands trading strategy with our complete reversal indicator for ThinkOrSwim. Learn to identify high-probability mean reversion trades with precise entry signals.
Download Free →
Candle Counter
Learn how to build a powerful candle counter indicator for ThinkOrSwim that tracks consecutive green and red candles. Get max counts, averages, and histogram visualization to understand market patterns.
Download Free →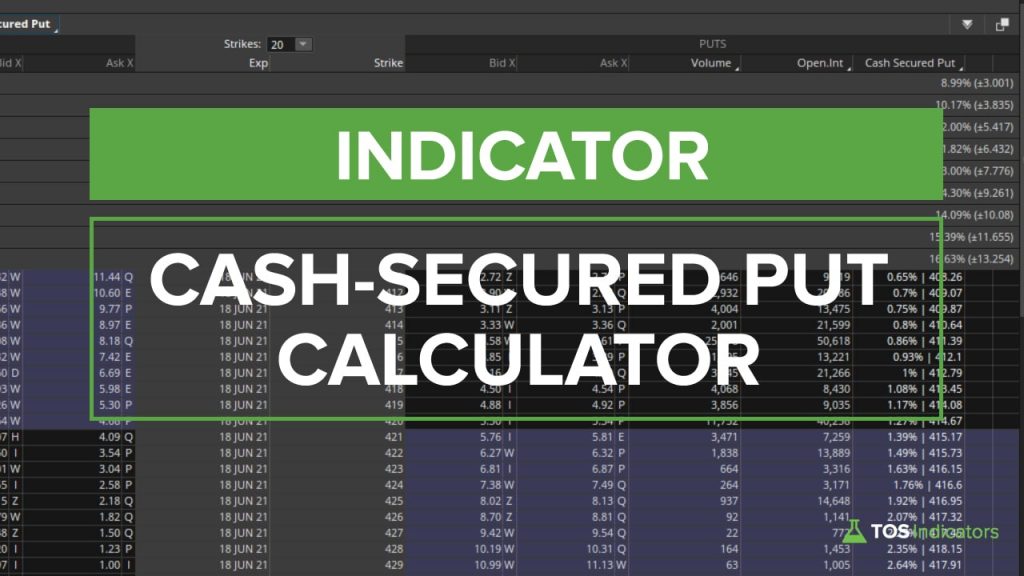 Free
Free
Cash-Secured Put Calculator
Build the ultimate put calculator for ThinkOrSwim that instantly calculates returns, breakeven prices, and profit targets for any put option strategy
Download Free →All ThinkOrSwim Indicators
Browse our complete library of custom ThinkOrSwim indicators with thinkScript code and tutorials.
Indicators 49 indicators
Adv. Covered Call Calculator Pro
Master the Adv. Covered Call Calculator Pro to spot high-probability trades, and transform your trading with proven strategies.
Anchored VWAP
Step-by-step tutorial showing how to build a custom Anchored VWAP indicator for ThinkOrSwim using ThinkScript. Learn to anchor VWAP to any date and time for precise support and resistance analysis.
Average Volume Stats
Learn to build a dynamic volume indicator for ThinkOrSwim that compares today's volume with historical averages using customizable timeframes and clean formatting.
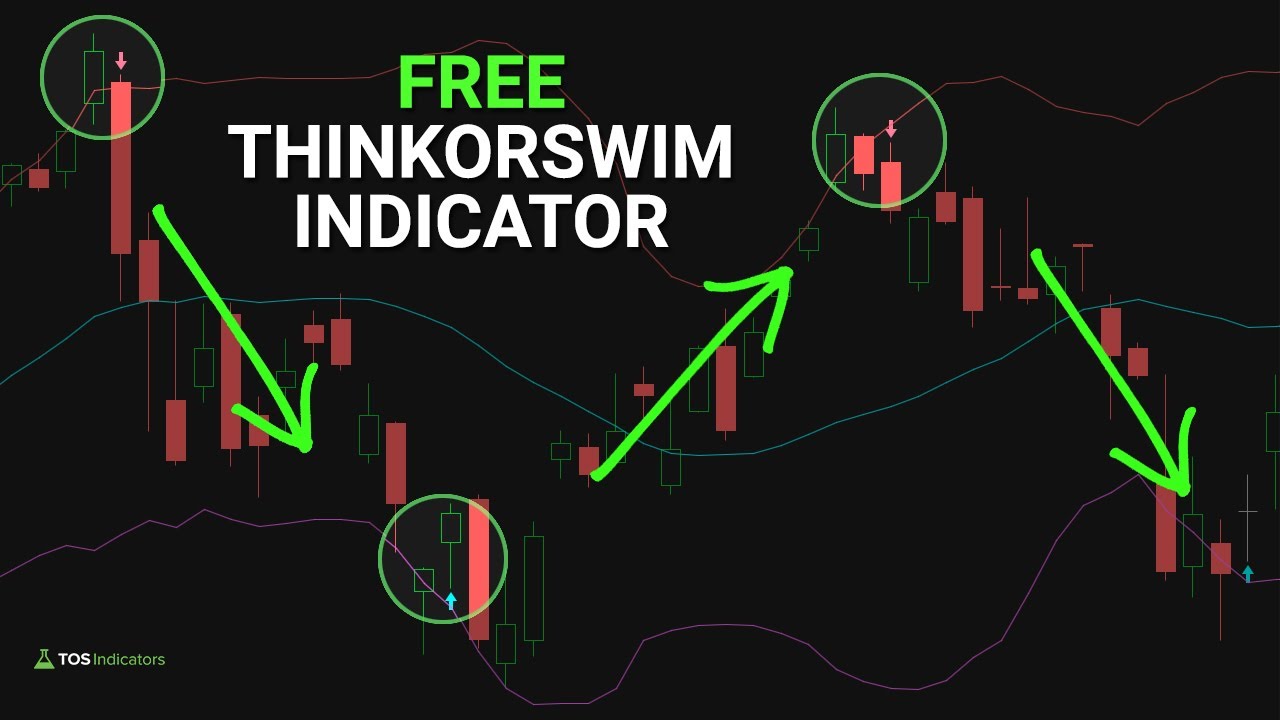
Bollinger Bands Reversal
Master the most popular Bollinger Bands trading strategy with our complete reversal indicator for ThinkOrSwim. Learn to identify high-probability mean reversion trades with precise entry signals.
Candle Counter
Learn how to build a powerful candle counter indicator for ThinkOrSwim that tracks consecutive green and red candles. Get max counts, averages, and histogram visualization to understand market patterns.
Cash-Secured Put Calculator
Build the ultimate put calculator for ThinkOrSwim that instantly calculates returns, breakeven prices, and profit targets for any put option strategy
Commodities Tracker
Track 10 major commodities (incl. gold, silver, oil, copper) in one view, to identify acceleration phases and outlier opportunities.
Covered Call Calculator
Build a powerful covered call calculator for ThinkOrSwim that automatically calculates return percentages across all strikes and expiration dates
Cumulative Advance Decline Trading System
Build an introductory trading system using the Advance Decline line, by taking a basic indicator and extracting patterns and signals.
Cumulative TICK
Learn how to build a powerful cumulative TICK indicator for ThinkOrSwim that tracks NYSE market internals throughout the trading day. Master market breadth analysis with this comprehensive ThinkScript tutorial.
Cumulative TICK Pro Pro
Master the Cumulative TICK Pro Pro to spot high-probability trades, and transform your trading with proven strategies.
DCA Calculator Pro
Build a comprehensive dollar cost average calculator for ThinkOrSwim that compares traditional monthly DCA with red days investing strategy performance.
Dividend Yield
Learn how to build a comprehensive dividend yield indicator for ThinkOrSwim that calculates yield using two methods, tracks payout frequency, and provides color-coded alerts based on your threshold settings.
Dividend Yield Pro Pro
Members-only dividend analysis tool that reveals yield traps and value opportunities through historical range analysis, moving averages, and growth tracking.
Dynamic RSI
Learn how to create a powerful Dynamic RSI indicator in ThinkOrSwim that combines traditional RSI with Bollinger Bands, automatic trend lines, and squeeze detection for superior overbought/oversold signals and trend identification.
Edge Signals Pro
The Edge Signals indicator is our custom-built oversold/overbought indicator, with a momentum twist built-in
Extreme TICK Counter
Track daily extreme market sentiment with a ThinkOrSwim TICK counter. Automatically measures +1000/-1000 readings to identify buying/selling pressure.
Heiken Ashi Trend Indicator
Download our Custom Heiken Ashi indicator for ThinkOrSwim. Full ThinkScript code, formula breakdown, and tutorial. Free Download!
How to Import a Study into ThinkOrSwim
Three ways to load custom code into ThinkOrSwim: import a shared study link, share a full workspace, and paste raw ThinkScript from the web.
Keltner Channel Wedges
Easily find mean-reversion trades with powerful Keltner Channel Wedges that alert you when price closes outside of the bands.
Market Pulse
Build a powerful trend trading indicator, that automatically identifies the 4 market stages and helps you profit from them.
Momentum Cross Indicator
Discover how to identify short-term reversals using ThinkOrSwim's live scanner. Leverage hourly/daily volatility breaches for precise trade setups.
Moving Average Clouds
Learn how to build a dynamic moving average clouds indicator for ThinkOrSwim with customizable MA types, dynamic color coding, and cloud visualization between two moving averages.
MTF Market Pulse Pro
Master multi-timeframe analysis with MTF Market Pulse Pro for ThinkOrSwim. Track higher timeframe trends while executing precision trades on lower intervals.
Multi Time Frame (MTF) DMI
Build a powerful DMI breakout indicator, that incorporates multiple time frames to quickly perform technical analysis across multiple charts.
Multi-Time Frame (MTF) Squeeze Indicator
Build a powerful multi-timeframe squeeze indicator that displays TTM squeeze conditions across all timeframes in one visual dashboard for ThinkOrSwim
Multiple Time Frame Moving Averages
Learn how to create multiple time frame moving averages in ThinkOrSwim using ThinkScript aggregation periods to display daily, hourly, and intraday moving averages on a single chart for enhanced technical analysis.
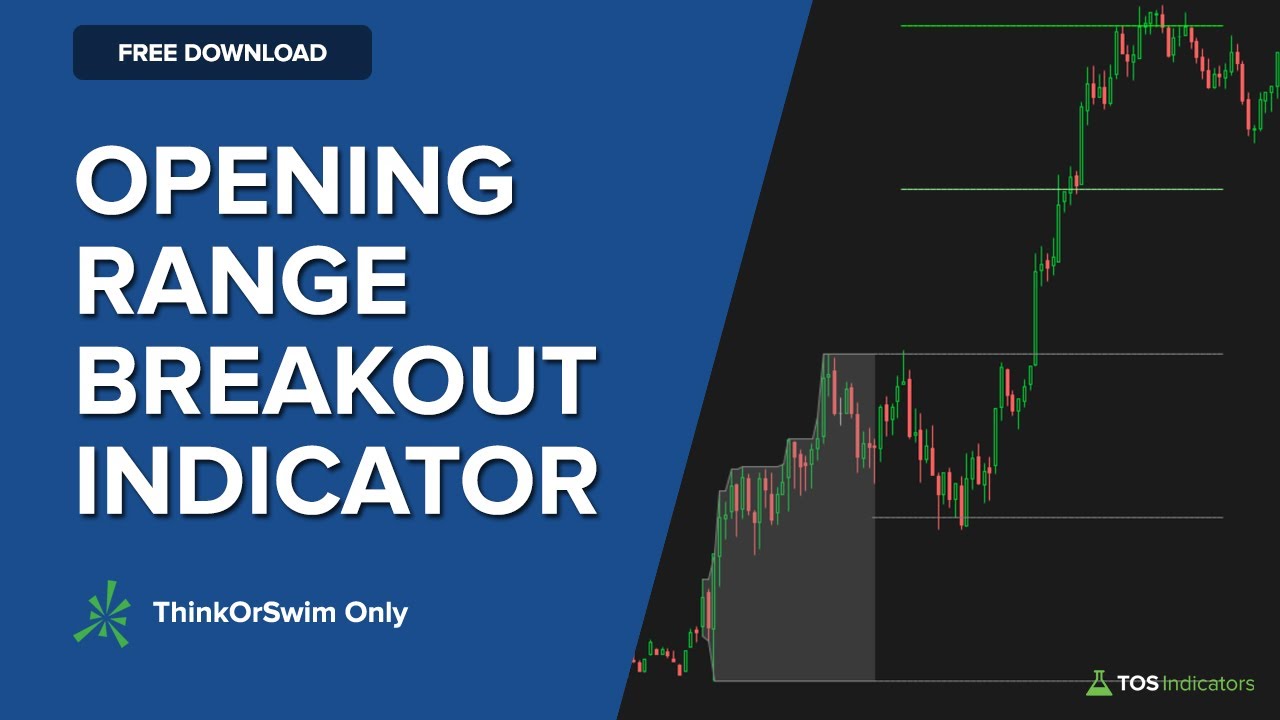
Opening Range Breakout
Build a powerful Opening Range Breakout indicator in ThinkOrSwim with different opening ranges, entry types, and target projection.
Option Chain Relative Value
Build a custom ThinkScript that compares current option prices to historical values and displays percentage changes for smarter options trading decisions
P/E Ratio
Build a comprehensive P/E ratio indicator with historical context, median analysis, and automatic valuation signals for better fundamental analysis in ThinkOrSwim
Parabolic SAR
Learn advanced Parabolic SAR trading strategies in ThinkOrSwim. Build custom SAR indicators, create market scans, and develop backtesting systems for improved trend following and reversal detection.
Pre-Earnings Analysis Pro
Master the Pre-Earnings Analysis Pro to spot high-probability trades, and transform your trading with proven strategies.
Price to Book Ratio Calculator
Learn to build a custom Price to Book ratio calculator and discover undervalued stocks easily inside of ThinkOrSwim.
Rate of Change
Build a range-bound Rate of Change indicator with RSI confluence for ThinkOrSwim that identifies momentum reversals with better precision.
Relative Performance
Build a flexible relative performance indicator for ThinkOrSwim that compares stocks against any benchmark using bars or specific dates for instant outperformance analysis.
Reversion to 50 Day SMA
Learn how to build powerful mean reversion scanners and strategies for ThinkOrSwim using the 50-day Simple Moving Average
Seasonal Analysis
Analyze 20+ years of monthly performance data and win rates for any stock or ETF with color-coded labels showing the strongest months.
Simple Breakout Tool
Build a simple breakout tool for ThinkOrSwim that combines moving averages, MACD, and stochastics.
Smarter Earnings
Analyze what price tends to do on the day of earnings, and find the best strategy to take advantage and profit from an earnings report.
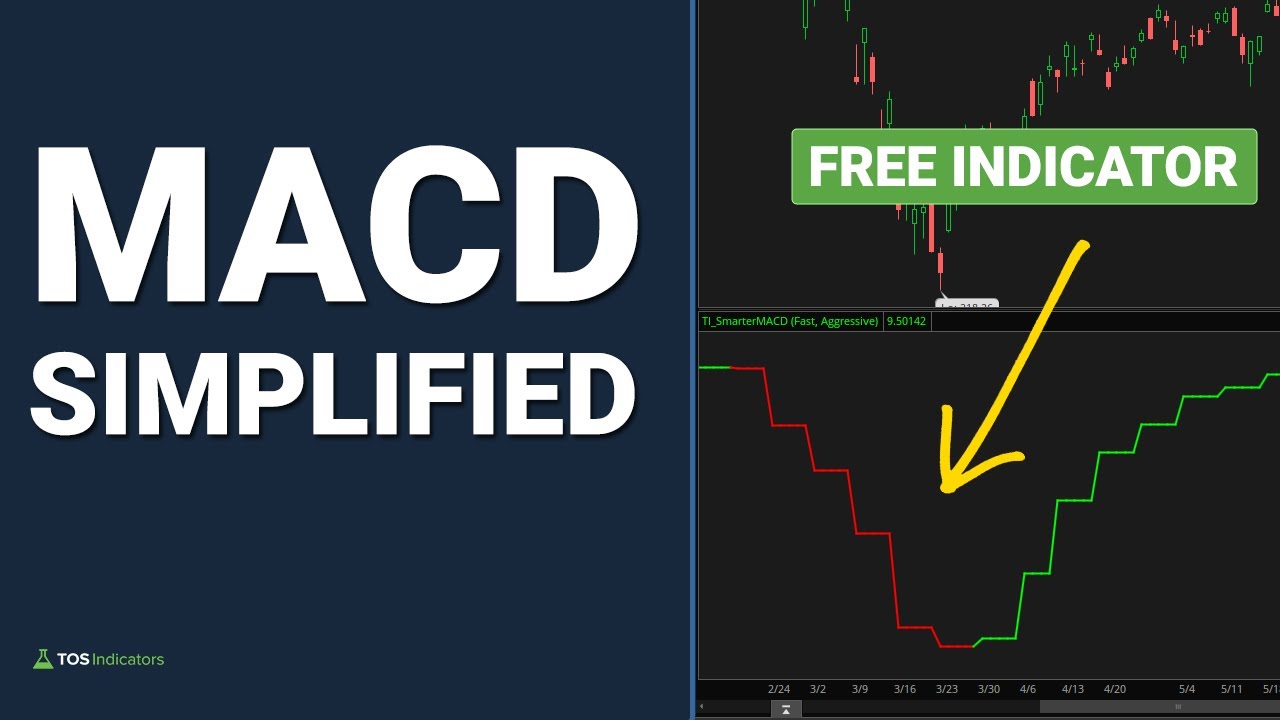
Smarter MACD
Turn the basic MACD into a powerful indicator, with built-in higher time frame analysis and multiple levers and modes.
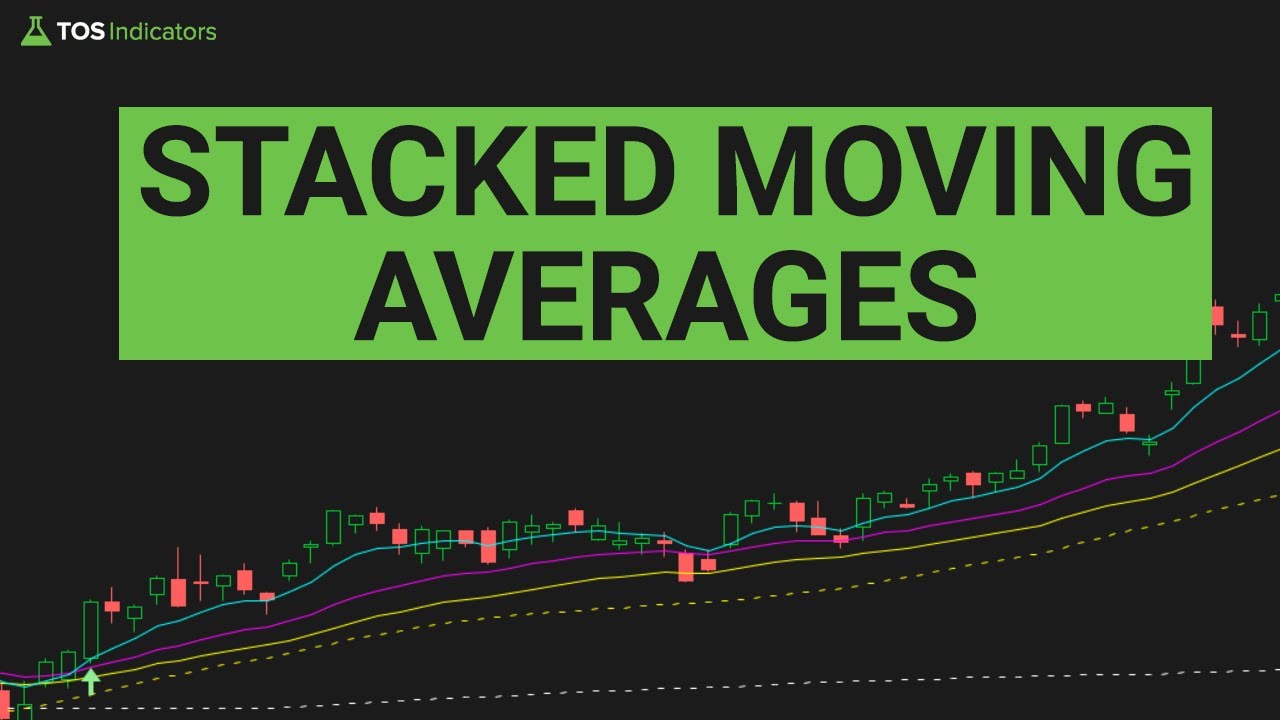
Stacked Moving Averages
Find the best trends with stacked moving averages, including the 8, 21, and 34 EMA's and the 50 and 200 SMA's.
Super Bowl Indicator
How effective is the Super Bowl in predicting market returns? Test this stock market theory, going back to the very first Super Bowl.
Supply Demand Edge
Easily spot supply/demand imbalances in the marketplace, and identify divergences that you can leverage in your trading.
Trend Squeeze
Build a powerful TTM Squeeze trend indicator combining stacked moving averages with squeeze detection to find high-probability trend continuation setups.
Volume Intensity
Use ChatGPT to build a volume indicator with multi-symbol tracking and volume intensity color-coding for quick, clear analysis.
Volume Zone Oscillator
Learn how to build an advanced Volume Zone Oscillator (VZO) indicator with smart confirmation signals, color-coded candles, and automated buy/sell arrows for ThinkOrSwim
VScore
Build the VScore trading indicator which helps you understand and plot price behavior in relation to its standard deviation, using the VWAP bands.
Wheel Option Calculator Pro
Master the Wheel Option Calculator Pro to spot high-probability trades, and transform your trading with proven strategies.
Wilder’s Momentum Concept
Learn how to build Wilder's Momentum Concept indicator for ThinkOrSwim using simple ThinkScript code. Master this 40-year-old momentum trading strategy with our complete tutorial and free download.
Squeeze Course Indicators 7 indicators
Triple Pro Squeeze Course
Advanced TTM Squeeze with three squeeze levels for catching hidden consolidation patterns.
Squeeze Signals Course
Entry and exit signals based on squeeze momentum with trend confirmation.
MTF Squeeze Histogram Course
Multi-timeframe squeeze histogram for analyzing squeeze alignment across timeframes.
MTF Triple Squeeze Course
Monitor Triple Pro Squeeze across 17 different timeframes simultaneously.
Slingshot Squeeze Course
Identifies high-probability squeeze setups with slingshot momentum patterns.
Multi-Market Squeeze Analyzer Course
Analyze squeeze conditions across multiple markets and symbols at once.
Multi-Market Trend Analyzer Course
Track trend alignment across multiple markets for squeeze trade confirmation.
How to Build ThinkOrSwim Indicators
Learn how to create your own custom indicators with these step-by-step thinkScript tutorials.
ThinkOrSwim Indicators FAQ
To add custom indicators to ThinkOrSwim, go to Studies > Edit Studies > Create. Paste the thinkScript code and save. You can also import shared studies by going to Setup > Open Shared Item and entering the share link. Our free ThinkOrSwim indicators include download links with one-click installation.
The best free ThinkOrSwim indicators depend on your trading style. For trend trading, Market Pulse and Stacked Moving Averages are excellent. For breakouts, try the Opening Range Breakout indicator. For mean reversion, Keltner Channel Wedges and Bollinger Bands Reversal work well. All our indicators are free to download with thinkScript code included.
Yes, ThinkOrSwim has a built-in programming language called thinkScript that lets you build custom indicators. You can create studies, strategies, scans, and alerts. Our indicator tutorial videos show you step-by-step how to build indicators from scratch, typically in 15-30 minutes.
For day trading in ThinkOrSwim, focus on indicators that identify intraday momentum and key levels. The Opening Range Breakout indicator plots morning range levels. Cumulative TICK tracks market breadth. Market Pulse shows trend stages. Edge Signals identifies overbought/oversold conditions for reversals.
ThinkOrSwim comes with hundreds of built-in indicators for free. You can also add custom indicators created by the community. All our basic ThinkOrSwim indicators are free to download. We also offer Pro versions with additional features for Volatility Box members.
Most successful traders use 2-4 indicators that complement each other. Avoid indicator redundancy (multiple momentum indicators saying the same thing). A good setup might include one trend indicator (Market Pulse), one momentum indicator (Edge Signals), and one volume indicator (Cumulative TICK).
For swing trading in ThinkOrSwim, use indicators that identify multi-day trends and reversals. Seasonal Analysis shows historical patterns. Keltner Channel Wedges spots mean reversion setups. The Trend Squeeze indicator identifies consolidation before big moves. Moving Average Clouds help visualize trend direction.
Yes, most ThinkOrSwim indicators can trigger alerts. Right-click on any study and select "Add Alert" to create notifications when conditions are met. You can receive alerts via popup, sound, email, or mobile notification. Our indicators are built with alert-compatible signals.
Get Pro ThinkOrSwim Indicators
Unlock advanced indicators and features with the Volatility Box membership.